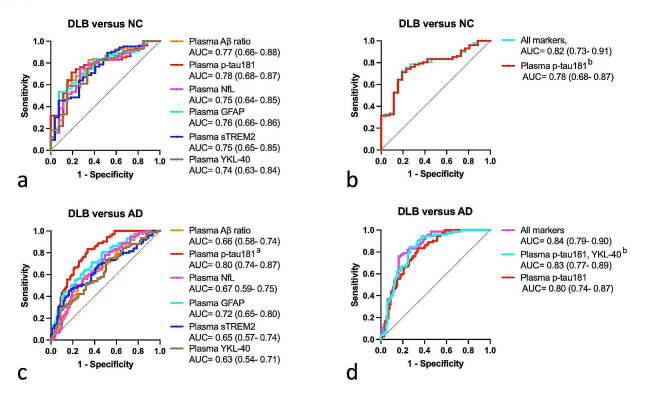
Fig. 2.
Plasma biomarkers performance to identify DLB. ROC analysis: a, to compare single biomarkers performance to discriminate between DLB patients and NC; b, to compare biomarkers combination to discriminate between DLB and NC; c, to compare single biomarkers performance to discriminate between DLB and AD patients; d, to compare biomarkers combination to discriminate between DLB and AD patients. ROC analysis results are presented as AUC (95% CI). Combinations of biomarkers were selected through binary logistic regression with backward stepwise elimination, including age and sex as constant variables. a model including p-tau181 outperformed all other models (∂AIC > 4), b no significant difference in the model’s fit with the All markers model (∂AIC < 4).

