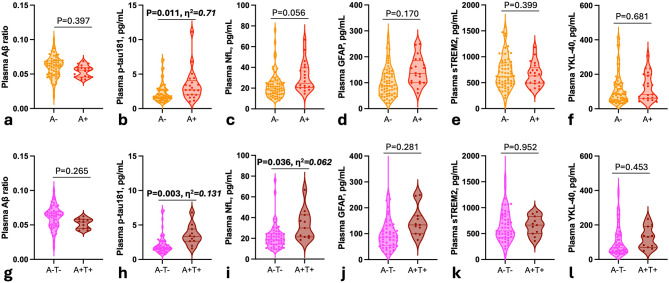
Fig. 3.
Plasma biomarkers levels in relation to amyloid pathology in DLB patients. Plasma biomarkers levels across amyloid-negative (A-) DLB and amyloid-positive (A+) DLB patients including a, Aβ ratio; b, p-tau181; c, NfL; d, GFAP; e, sTREM2; f, YKL-40; and across A-T- DLB and A + T + DLB patients including: g, Aβ ratio; h, p-tau181; i, NfL; j, GFAP; k, sTREM2; l, YKL-40. For biomarker levels comparison, P-values were obtained through one-way ANCOVA adjusting for multiple comparisons. Significant differences (P < 0.05) are reported in bold. The effect size was determined using η2. Boxplots display the median, IQR, and value for all participants

