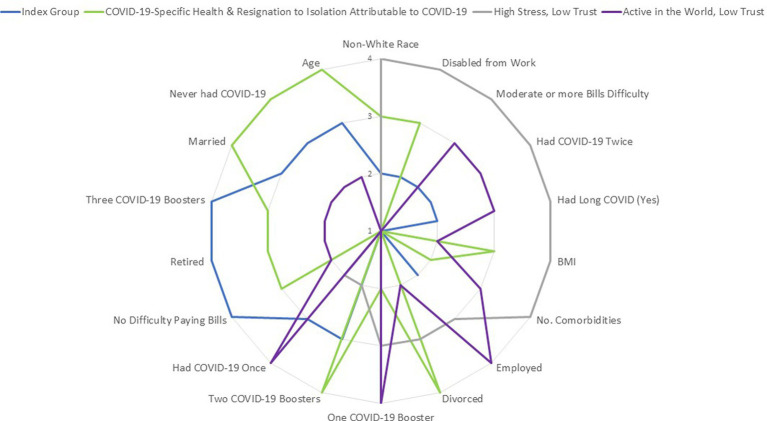
Figure 4.
Radar chart of prominent characteristics by profile group. This radar chart summarizes the four profile-group differences in the sociodemographic variables compared. Only variables with at least a small ES difference are shown. Higher ranks reflect having a higher proportion with, or scores on, this characteristic. For ease of comparison, the ranks shown in this figure were sorted first by Profile 3 and then by Profile 1, so that pertinent characteristics were grouped together on the radar plot.

