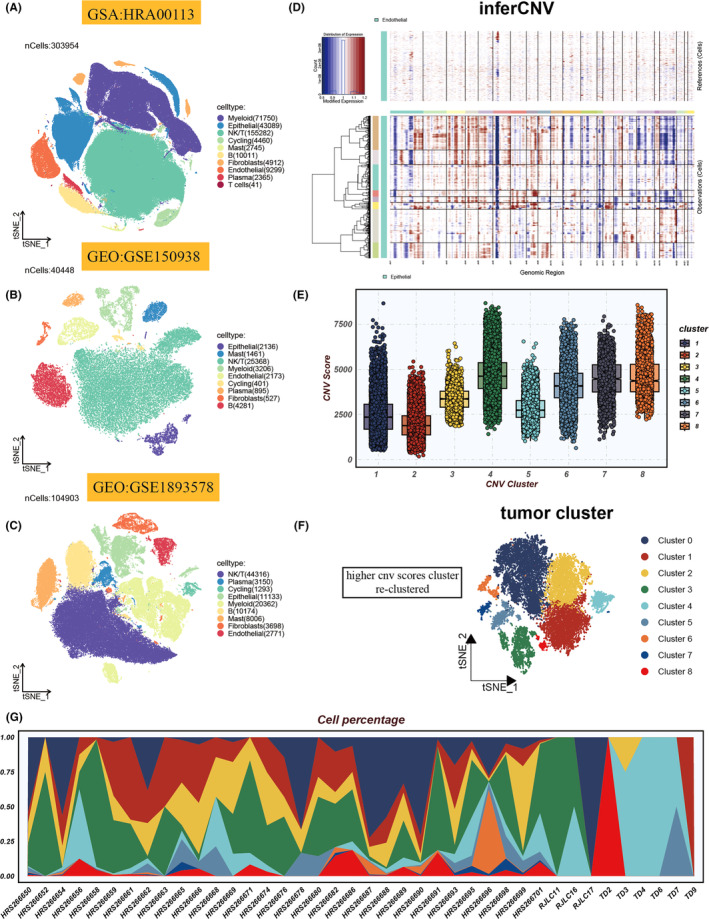
FIGURE 2.

Cellular heterogeneity and genomic alterations in single‐cell analyses. (A–C) t‐distributed stochastic neighbour embedding (tSNE) visualizations highlight cell type distributions within HRA00113, GSE150938 and GSE189357 scRNA‐seq cohorts. (D) A heatmap delineates cell‐wise genomic copy number variations (CNVs), calculated from gene expression proximal to chromosomal loci, with amplifications in red and deletions in blue. (E) Box plots reveal CNV patterns across eight identified clusters. (F) tSNE plot illustrates the spatial distribution of tumour subgroups. (G) The relative abundance of nine tumour cell clusters across various samples is depicted.
