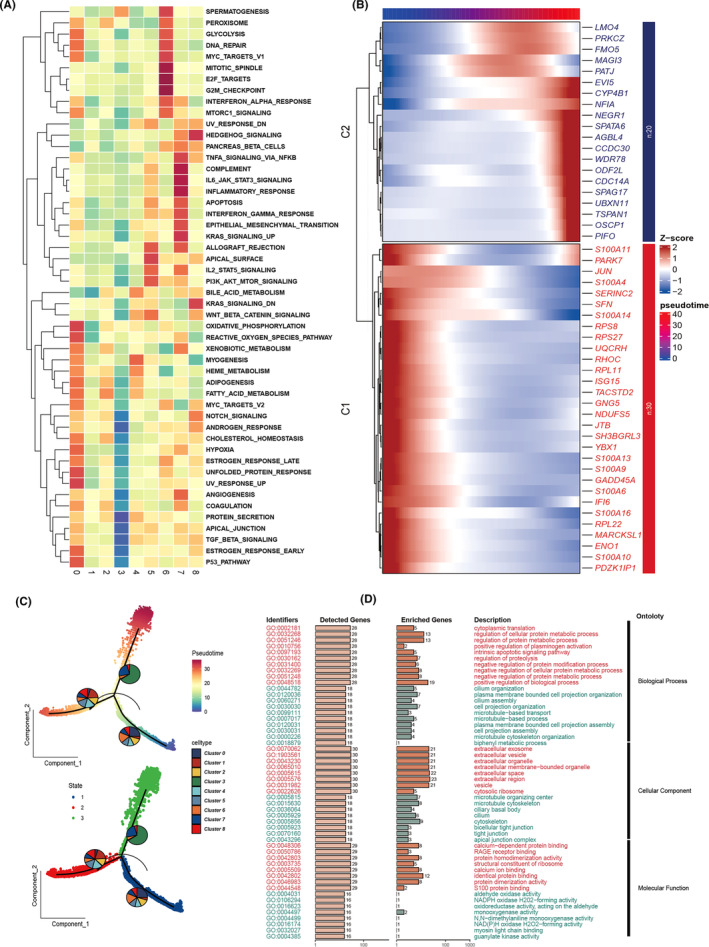
FIGURE 3.

Decoding tumour cell cluster dynamics. (A) Enrichment analysis across distinct tumour cell clusters using Gene Set Variation Analysis (GSVA), visualized through a heatmap. (B) Expression dynamics across pseudotime are depicted in a heatmap, showcasing gene expression intensity variations. (C) Developmental trajectories of various tumour cell clusters are illustrated via pseudotime analysis, with cells colour‐coded based on tumour clusters or progression through pseudotime. (D) Gene ontology (GO) enrichment analysis identifies and highlights enriched pathways in genes from Clusters 1 and 2 as shown in (B), covering aspects of biological process (BP), cellular component (CC) and molecular function (MF).
