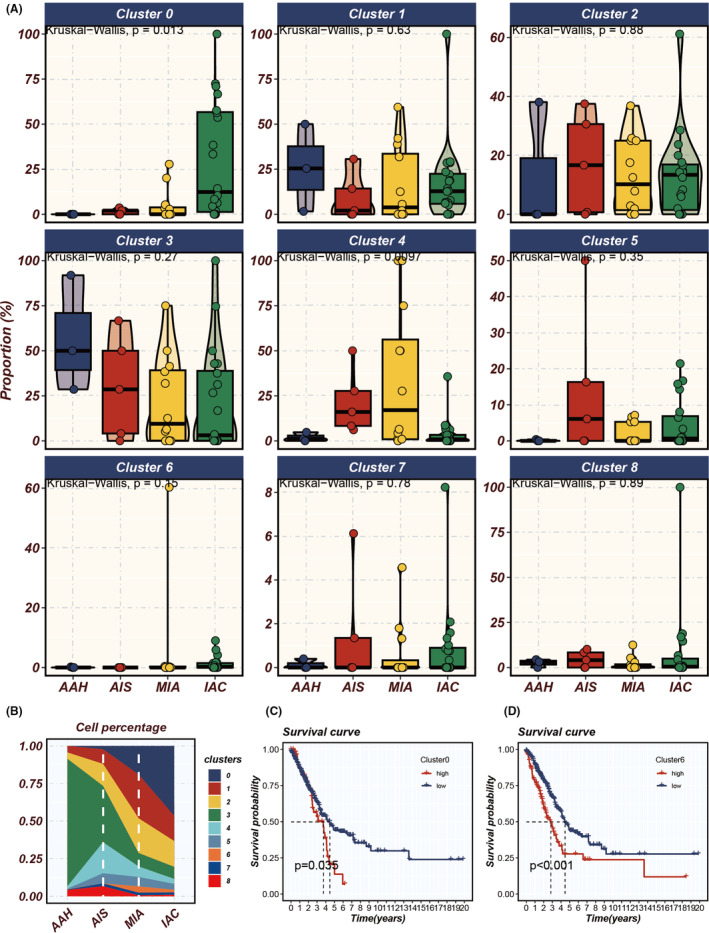
FIGURE 5.

Analysing tumour cluster dynamics and survival impact in LUAD progression. (A) Proportional variations of different tumour clusters throughout the progression of LUAD (from atypical adenomatous hyperplasia [AAH] to adenocarcinoma in situ [AIS], minimally invasive adenocarcinoma [MIA] and finally to invasive adenocarcinoma [IAC]). (B) The prevalence of distinct tumour cell clusters during the progression stages. (C, D) Single‐sample Gene Set Enrichment Analysis (ssGSEA) assessing the impact of the abundance of Clusters 0 and 6 on the survival of patients with LUAD, where higher abundance indicates poorer prognosis.
