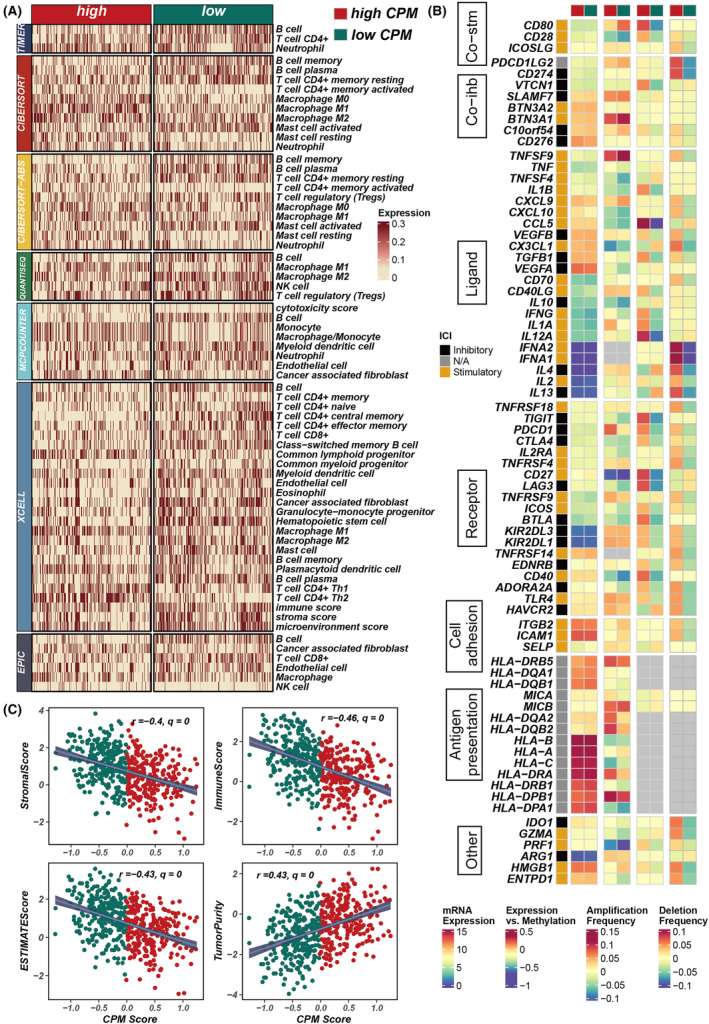
FIGURE 8.

Assessment of immune infiltration and correlation with CPM scores in LUAD. (A) A heatmap illustrating the variance in immune infiltration scores between groups with high and low CPM scores. (B) Analysis depicting the relationship between CPM scores and the expression of immune‐related genes. (C) Scatter plots revealing the associations between CPM scores and various tumour microenvironment metrics, including stromal scores, immune scores, ESTIMATE scores and tumour purity.
