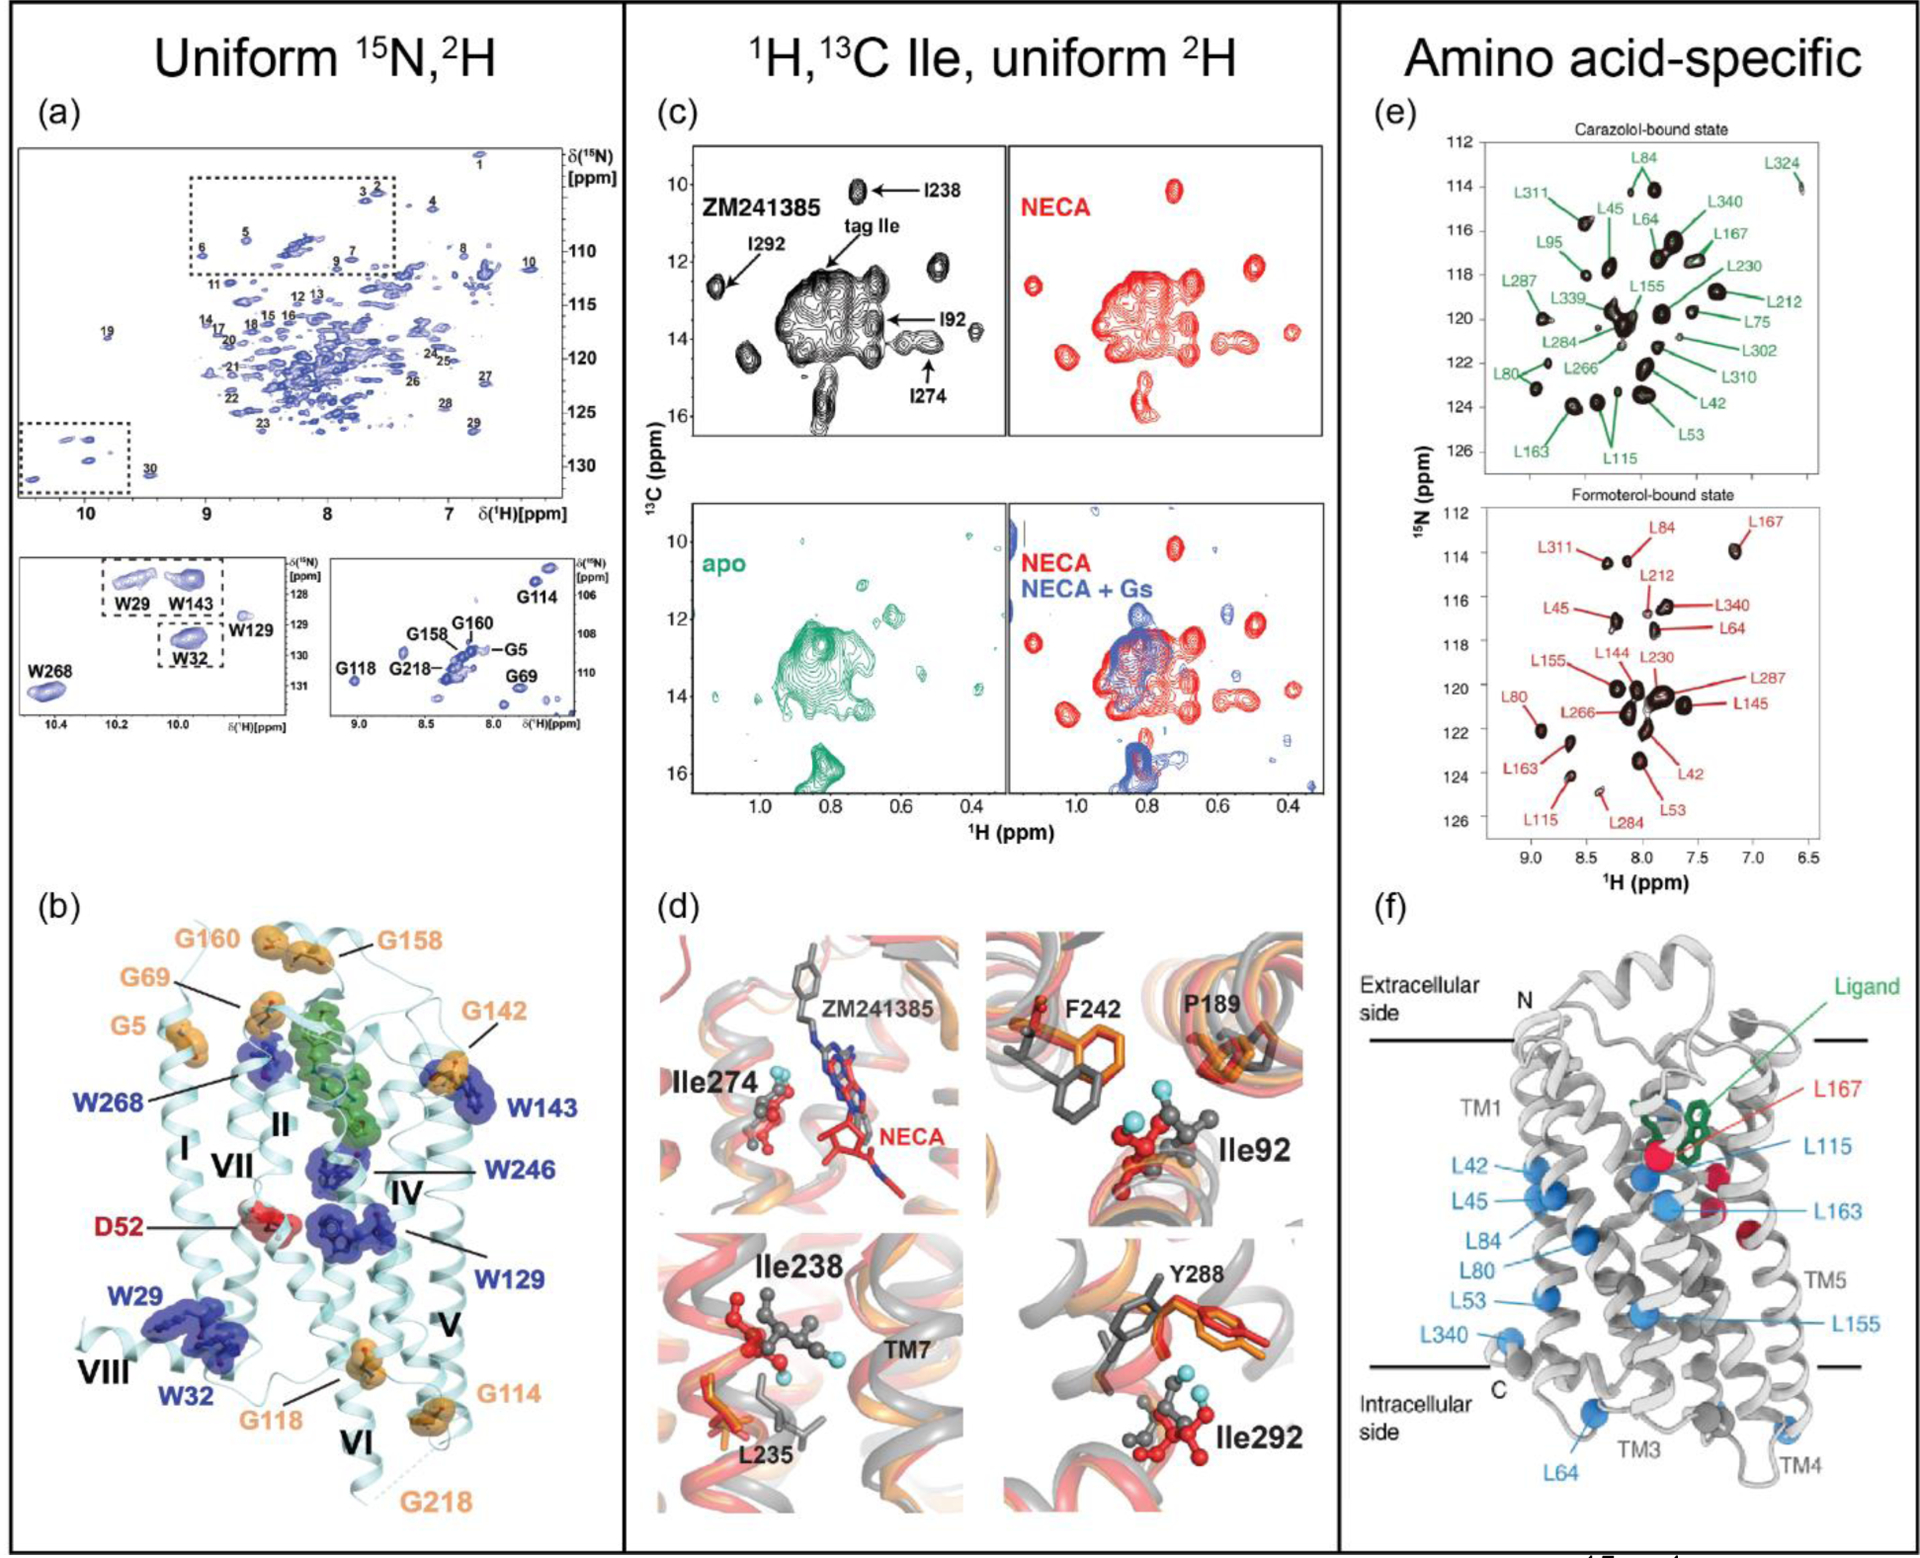
Figure 1.

Insights from NMR into ligand-stimulated GPCR activation. (a) 2D [15N,1H]-TROSY spectrum of [u-15N, ~70% 2H]-A2AAR in complex with the antagonist ZM241385. Regions containing Trp indole 15N−1H and Gly backbone signals are expanded. (b) Assigned signals mapped onto an A2AAR crystal structure (PDB 6AQF) with the antagonist ZM241385 shown in green and conserved residue Asp52 in red. (c) [13C,1H]-HMQC spectra of several complexes of [1H,13C-Ile δ1, u-2H]-A2AAR with assigned signals annotated. (d) Superimposed crystal structures of A2AAR in complex with the antagonist ZM241385 (gray, PDB 4EIY), agonist NECA (red, PDB 2YDV), and agonist UK432097 (orange, PDB 3QAK), highlighting regions where significant chemical shift changes were observed. (e) 2D [15N,1H]-TROSY correlation spectra of [2,3,3-2H,15N Leu]-β2AR in complex with the antagonist carazalol and agonist formoterol. (f) Chemical shift differences observed between antagonist- and agonist-bound β2AR mapped onto the crystal structure of β2AR in complex with carazolol (PDB 2RH1); red spheres and blue spheres denote amide signals of leucine residues with chemical shift differences >0.4 ppm and <0.4ppm, respectively. Panels a and b adapted from reference 7, panels c and d adapted from reference 6, and panels e and f adapted from reference 24, with permission.
