Figure 1.
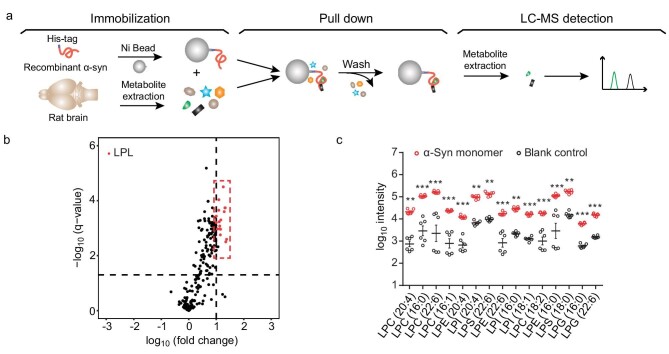
The α-syn monomer shows the preference for binding to LPLs in vitro. (a) Schematic illustration of the in vitro metabolite profiling assay developed in this study. His-tagged α-syn monomers were immobilized on Ni beads and incubated with metabolite extracts from rat brains. Bound metabolites were detected and identified by LC-MS-based metabolite profiling. (b) Volcano plots of the identified metabolites. LPLs that bind with the α-syn monomer with high significance and fold change are highlighted in red. The horizontal dashed line indicates a q-value of 0.05. The vertical dashed line indicates a fold change of 10. q-Values were calculated by Student's t-test followed by false discovery rates (FDR) correction. Fold change represents the metabolite intensity of the α-syn sample over that of the blank sample. (c) Intensities of the top-ranking LPLs that bind with the α-syn monomer in comparison with those of the blank control. Data represent the mean ± SEM (standard error of mean) (n = 6). *, q-value < 0.05; **, q-value < 0.01; ***, q-value < 0.001; Student's t-test followed by FDR correction.

