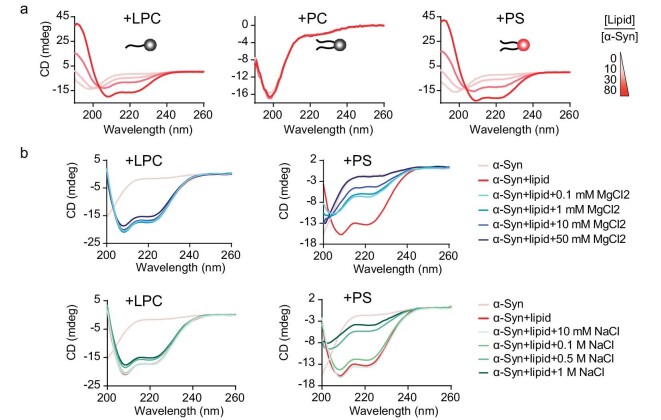
Figure 3.
LPC induces the structural transition of α-syn independent of electrostatic interaction. (a) The secondary structure transition of α-syn in the presence of LPC micelles, PC liposomes and PS liposomes monitored by circular dichroism (CD) spectroscopy. Lipid molecules are shown as cartoons with neutral head groups (in the left and middle panels) and negatively charged head groups (in the right panel). The color bar indicates the molar ratios of lipid/α-syn. (b) CD spectroscopy shows that as concentrations of salts (MgCl2 or NaCl) increase, the DOPS–α-syn interaction was disrupted accordingly, whereas the LPC–α-syn interaction was not apparently affected.

