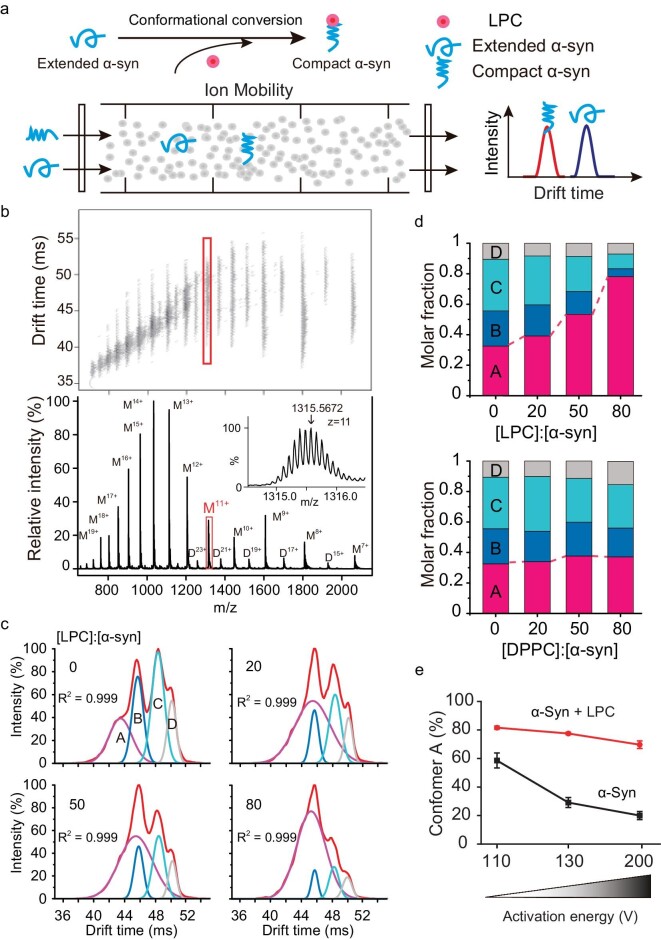
Figure 4.
LPC compacts α-syn and increases its stability. (a) The schematics of IM-MS technology. (b) IM-MS spectrum of α-syn with charge-state distributions. Monomeric charged state (11+) is highlighted with a frame, and is zoomed in with labels in the inset. (c) IM-MS spectrum isolated from 11+ charged α-syn was deconvolved into four conformers (A–D) on the basis of Ω acquired from α-syn in the presence of LPC. (d) Population distribution change of the four conformers (A–D) upon the addition of LPC (upper) and DPPC (lower). (e) The compact conformer A of α-syn is stabilized by LPC and resists activation-induced unfolding.

