Figure 1.
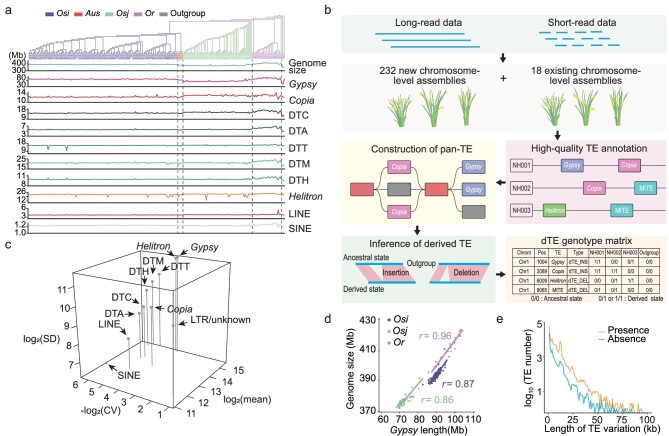
Construction of a pan-TE map and evaluation of TE variations in Asian accessions using chromosome-level genomes. (a) Landscape of genome size and TE content across different subpopulations. Phylogeny of 250 accessions were based on whole-genome SNPs (top); accessions in different subpopulations are indicated by different colors. Osi, Aus, Osj, Or and outgroup respectively refer to O. sativa indica, O. sativa aus, O. sativa japonica, O. rufipogon, and three non-Asian accessions (one O. glaberrima, one O. barthii and one O. glumaepatula). Length of genome and TE content (Mb) in each genome are indicated (bottom). The length of Gypsy, Copia, DTC, DTA, DTT, DTM, DTH, Helitron, LINE and SINE elements in each genome are indicated. (b) Overview of the pipeline for pan-TE map construction. Firstly, 232 high-quality chromosomal-level assemblies were de novo assembled by integrating public long-read and short-read data. After combining the de novo assemblies with 18 existing assemblies, the TE sequences were annotated and a TE library was generated. To construct a pan-TE map, the TE variations were identified by combing the results of genome alignment, the TE library and long-read data. Subsequently three non-Asian accessions were used as outgroups (henceforth ‘outgroup’) to infer whether a given TE variation was in derived state or ancestral state in each accession. A TE variation that has both derived state and ancestral state in Asian rice accessions was defined as derived TE variation (henceforth ‘dTE’). Ancestral state indicates that the genotype of the locus in a given accession (0/0) is the same as that of the outgroup (0/0); derived state indicates that the genotype of the locus in a given accession (1/1 or 0/1) is different from that of the outgroup (0/0), including homozygous (1/1) and heterozygous (0/1) genotype. Finally, a dTE genotype data set in matrix format is generated for use in downstream analysis, including domestication, gene expression and GWAS. (c) The copy number variation for different TE families in 250 natural accessions. The x axis represents the copy number variation for each TE family across accessions, evaluated as coefficient of variation (CV); the y axis represents the average number of TEs in each family; the z axis represents the differences in total TE number for each family among accessions in total TE number, evaluated as standard deviation (SD). (d) Pearson correlation coefficients for comparisons between total length of Gypsy elements and genome size across different subpopulations. Colored dots and lines indicate data from each subpopulation. (e) Length distributions of TE variations in the non-redundant TE data set for Asian accessions.

