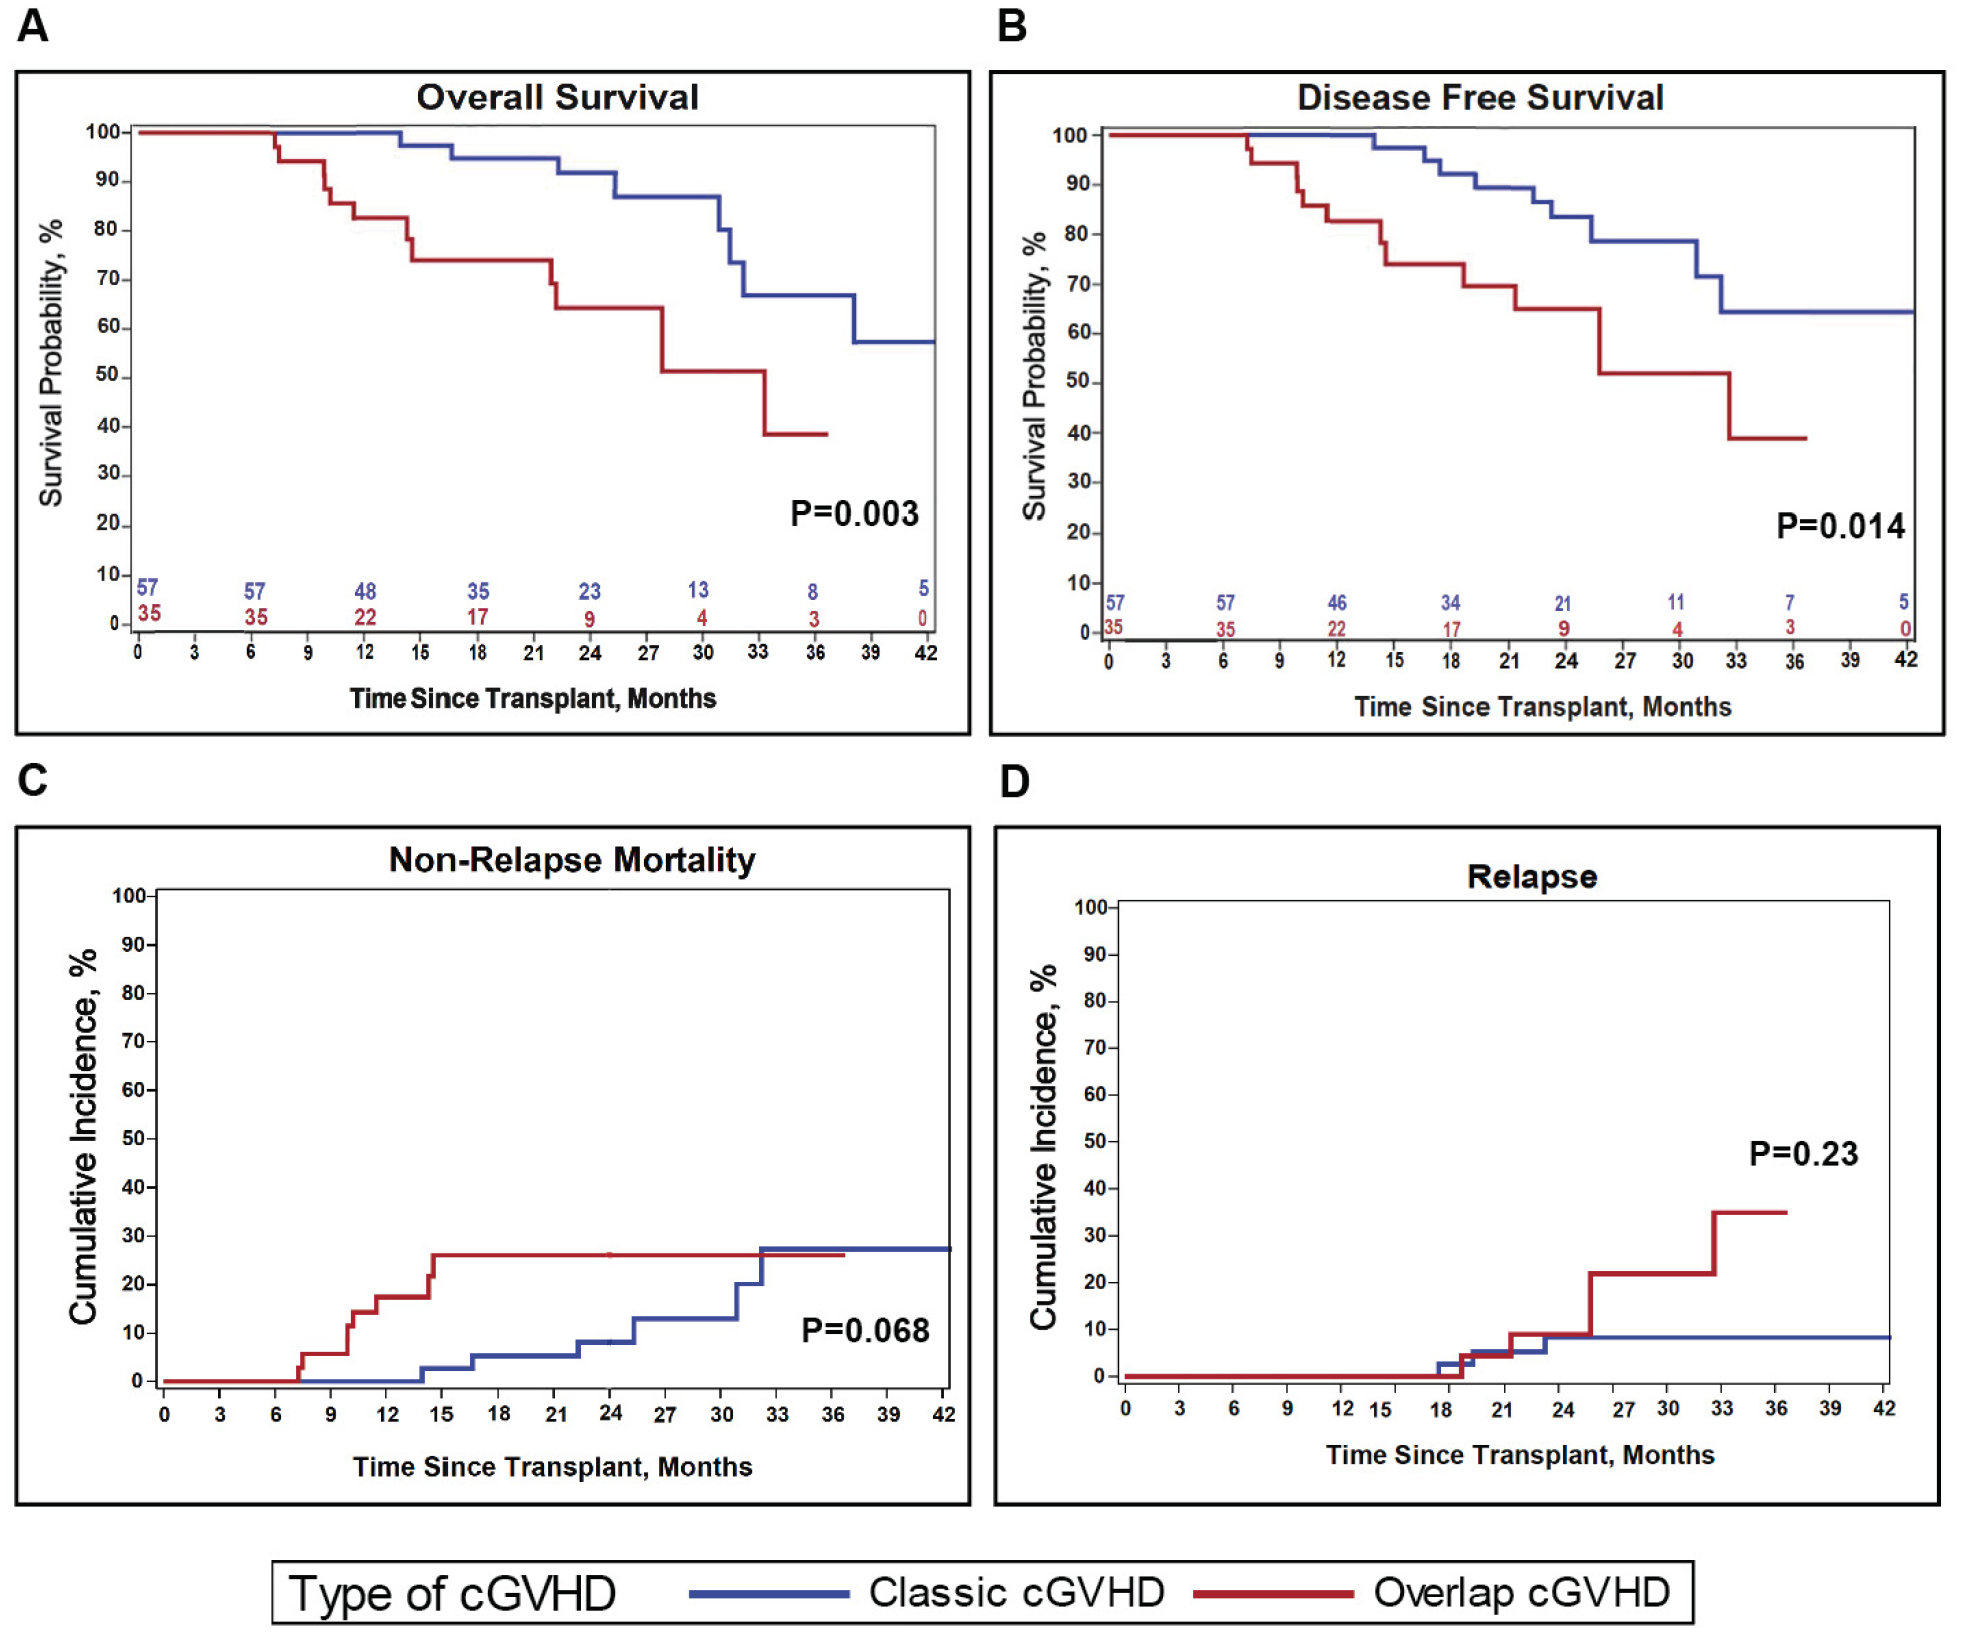
Figure 4. Key outcomes of classic cGVHD versus ocGVHD.

(A) Probability of OS. (B) Probability of DFS. (C) Cumulative incidence of NRM. (D) Cumulative incidence of TTR. For each graph, patient outcomes extend to 42 months. Blue: classic cGVHD. Red: ocGVHD. Note that the ocGVHD curves end at 37 months, which corresponds to the timepoint at which the patient in this group with the longest follow-up is censored. Beyond 42 months, 4 additional patients in the classic cGVHD group were censored, and there was 1 additional non-relapse death.
