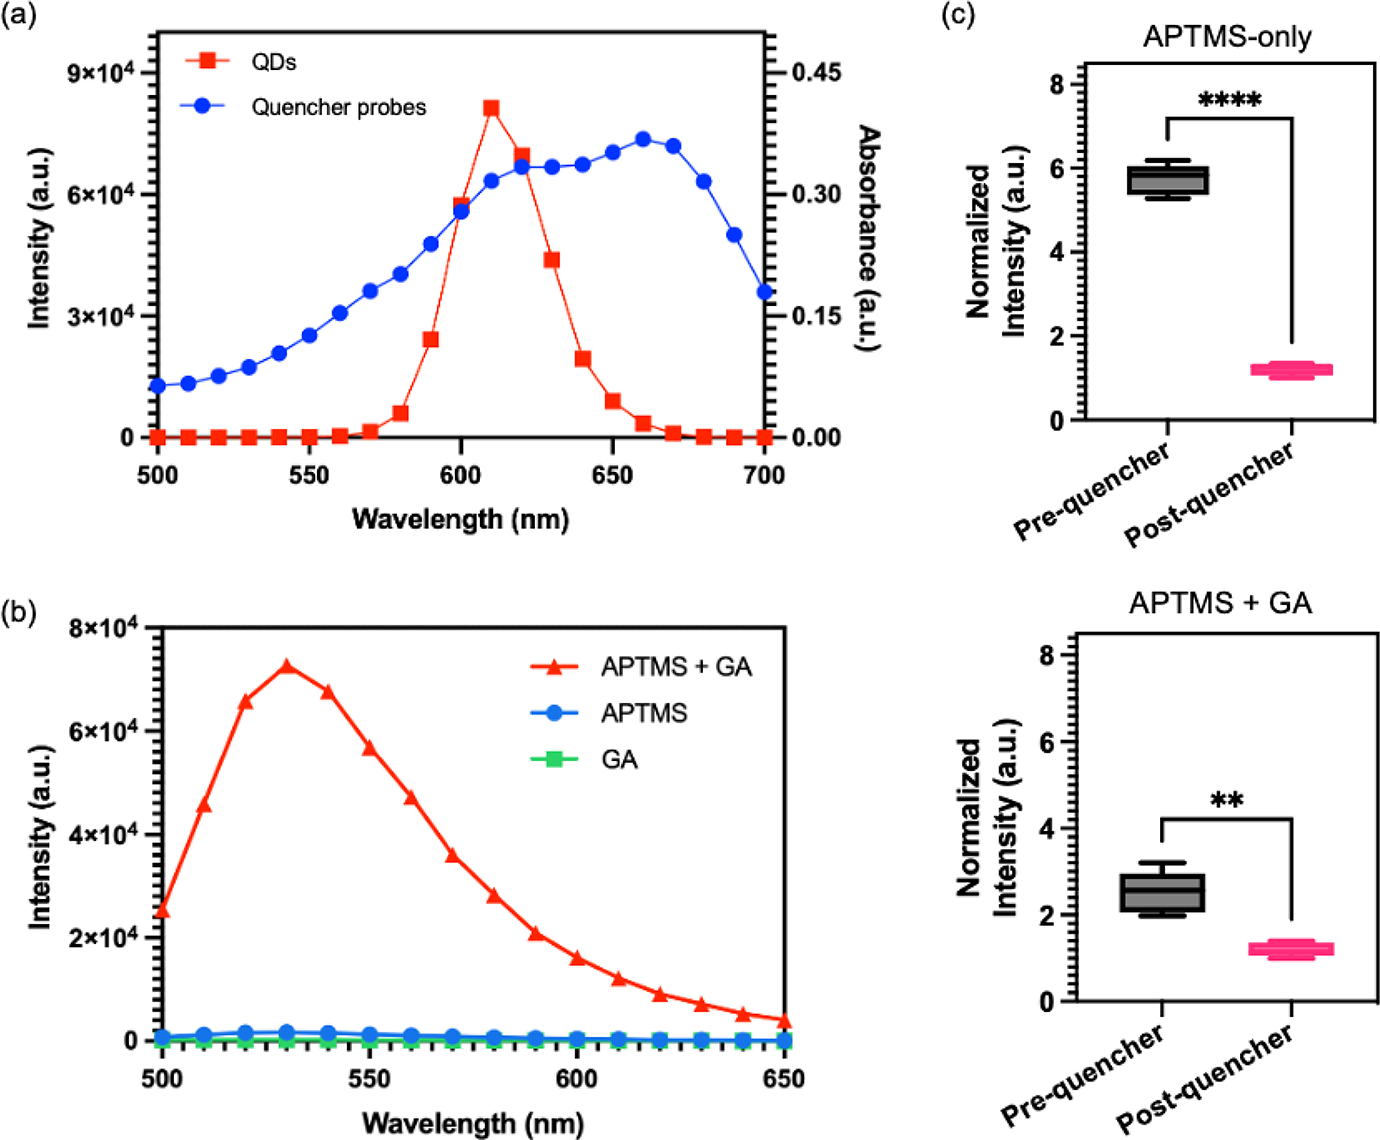
Figure 3.

Validation of PDMS surface treatment process. (a) Emission spectra of QDs excited at 450 nm (red) and absorption spectra of quencher probes (blue). (b) Emission spectra of the mixture (red) of aminopropyltrimethoxysilane (APTMS) and glutaraldehyde (GA), APTMS (blue), and glutaraldehyde (green). (c) Normalized fluorescence signals of QDs-coated micropillars pre- and post-conjugation with quencher probes. (Top) Micropillars treated with APTMS, QDs, and quencher probes. (Bottom) Micropillars treated with APTMS, GA, QDs, and quencher probes. Statistical analysis was performed using unpaired t-test analysis (ns = p > 0.05; * = 0.01 < P≤0.05; ** = 0.05 < P≤0.05; *** = 0.01 < P≤0.001; **** = P ≤ 0.0001).
