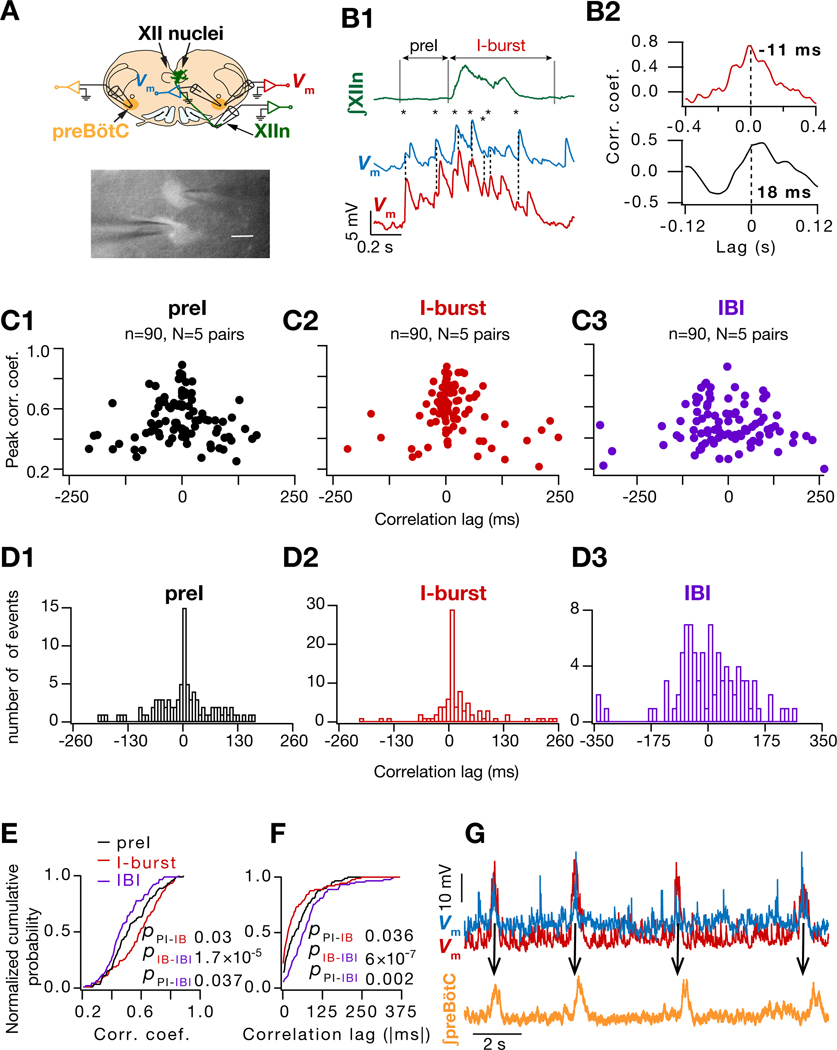
Figure 3. Increased synaptic correlation between I-M SST+ neuron pairs during preI and I-bursts is concurrent with their increased input synchrony.
(A) Top, Configuration for simultaneous recording of preBötC SST+ neuronal pairs with hypoglossal nerve (XIIn) and contralateral preBötC population activity; bottom, fluorescent micrograph of simultaneously patched SST+ neurons. (B1) ∫XIIn (green) and of two simultaneously recorded I-M SST+ neurons (blue, red) along with the crosscorrelograms (B2) during preI (black) and I-burst (red). Temporally aligned EPSP peaks indicated by dashed line and *. (C1-C3) Plots for peak correlation vs time lag for of I-M SST+ pairs (90 cycles from 5 pairs) during preI, I-burst and interburst interval (IBI) epochs. (D1-D3) Histogram of crosscorrelation lags for of I-M SST+ pairs for data in (C1-C3). (E-F) normalized cumulative histogram of crosscorrelation peaks (E) and lags (F) for events in (C1-C3). Kruskal Wallis test (E, p = 5×10⁻⁵; F, p = 9×10⁻⁸) followed by Wilcoxon signed rank test for pairwise comparisons (p values for color-coded pairwise comparisons). (G) of simultaneously recorded I-M SST+ pair (blue, red) along with ∫preBötC (orange) showing that ∫preBötC activity peaks after the peak of in each cycle. Also, see Figure S2.

