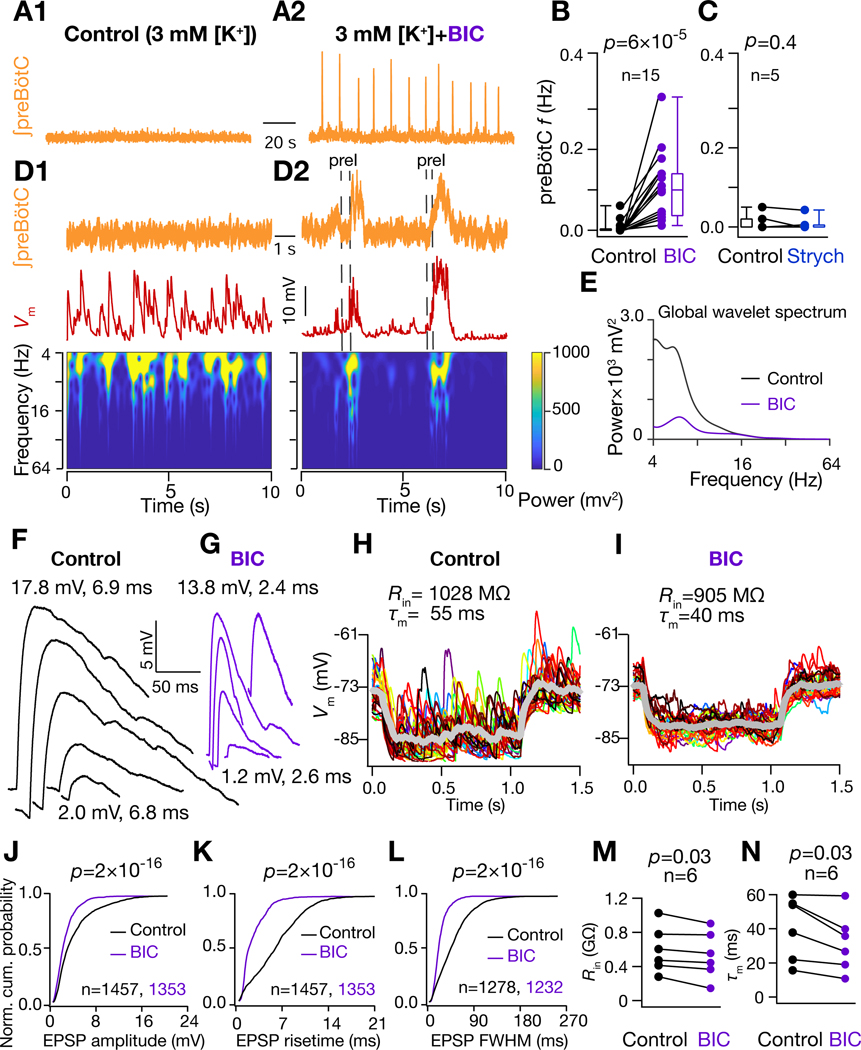
Figure 5. GABAAR inhibition regulates preBötC synchronization and conductance state of preBötC I-M SST+ neurons.
(A) preBötC activity under nonrhythmic control (3 mM [K+]; A1) and after addition of 10 μM Bicuculline (BIC) rhythmic (A2) conditions. (B-C) preBötC burst frequency under control and BIC (B) and 2 μM strychnine (Strych) (C) conditions. (D) Frequency-time plot for of I-M SST+ neuron under control (D1) and BIC rhythmic (D2) conditions. (E) Global wavelet spectrum of in (D1-D2). Note decrease in global wavelet power under rhythmic conditions with BIC. (F) and (G) spontaneous EPSPs extracted from traces in (D1) and (D2) respectively. Amplitude and 20%−80% rise times of largest (top) and smallest (bottom) EPSPs are indicated. (H-I) of I-M SST+ neuron in response to a 10 pA hyperpolarizing current under control (H) and under 10 μM BIC (I); individual traces span 30 trials (different colors) and thick grey traces represent averages. (J-L) Normalized cumulative probability for spontaneous EPSP amplitude (J), 20%−80% rise time (K), and full width at half maximum duration, FWHM (L), under control (black) and BIC rhythmic (purple) conditions; N=8 neurons from 8 brain slices. (M) Input resistance, , and (N) membrane time constant, , of I-M SST+ neurons recorded in control and BIC. For (B-C) and (M-N), p-values are for Wilcoxon signed rank test; for (J-L), p-values for Wilcoxon rank sum test. Also, see Figure S4.

