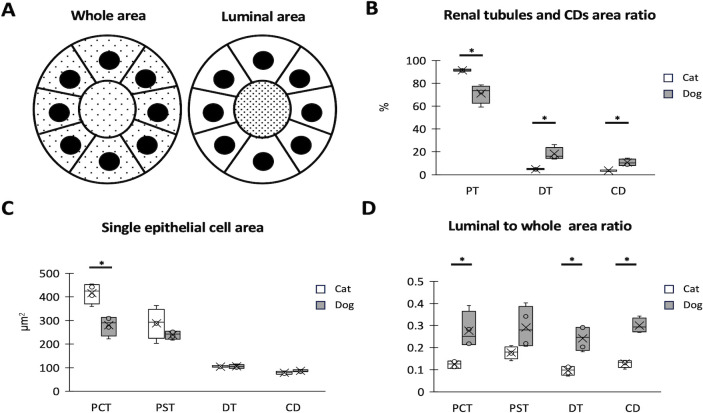
Fig 2. Histomorphometric characteristics of each renal tubule and collecting duct (CD) in adult cat and dog renal cortices.
(A) Definition of whole and luminal areas in renal tubules and CDs. The dotted area represents the defined area. (B) Occupation ratios of proximal tubules (PTs), distal tubules (DTs), and CDs per unit area. (C) Size of single epithelial cells in the proximal convoluted tubules (PCTs), proximal straight tubules (PSTs), DTs, and CDs. (D) The ratio of the luminal area to the whole area in renal tubules and CDs. The box plot represents the minimum, first quartile, median, third quartile, and maximum (n >4). (n = 4). Significance with other species (Mann–Whitney U-test, * P <0.05).

