Abstract
The mechanical property, microhardness, is evaluated in dental enamel, dentin, and bone in oral disease models, including dental fluorosis and periodontitis. Micro-CT (μCT) provides 3D imaging information (volume and mineral density) and scanning electron microscopy (SEM) produces microstructure images (enamel prism and bone lacuna-canalicular). Complementarily to structural analysis by μCT and SEM, microhardness is one of the informative parameters to evaluate how structural changes alter mechanical properties. Despite being a useful parameter, studies on microhardness of alveolar bone in oral diseases are limited. To date, divergent microhardness measurement methods have been reported. Since microhardness values vary depending on the sample preparation (polishing and flat surface) and indentation sites, diverse protocols can cause discrepancies among studies. Standardization of the microhardness protocol is essential for consistent and accurate evaluation in oral disease models. In the present study, we demonstrate a standardized protocol for microhardness analysis in tooth and alveolar bone. Specimens used are as follows: for the dental fluorosis model, incisors were collected from mice treated with/without fluoride-containing water for 6 weeks; for ligature-induced periodontal bone resorption (L-PBR) model, alveolar bones with periodontal bone resorption were collected from mice ligated on the maxillary 2nd molar. At 2 weeks after the ligation, the maxilla was collected. Vickers hardness was analyzed in these specimens according to the standardized protocol. The protocol provides detailed materials and methods for resin embedding, serial polishing, and indentation sites for incisors and alveolar. To the best of our knowledge, this is the first standardized microhardness protocol to evaluate the mechanical properties of tooth and alveolar bone in rodent oral disease models.
Introduction
Hardness is one of the mechanical properties (e.g., elasticity, hardness, viscoelasticity, and fracture behavior) and is commonly used to characterize the ability to resist compression deformation and fracture of a local area of a material. The static indentation hardness test is the most used method, including Vickers hardness and Knoop hardness1. The Vickers hardness test is implemented by pressing a diamond indenter into the surface under a fixed testing load. The indenter is pyramid-shaped, with a square base and an angle of 136° between opposite faces. The length of both diagonals formed on the test surface is measured, and the average is used to calculate the hardness, which is determined by the ratio F/A (where F is the force and A is the surface area of the indentation). The Vickers microhardness number (HV=F/A) is usually expressed in kilograms-force (kgf) per mm2 indentation, with 1 HV ≈ 0.1891 F/d2 (N/mm2). The Knoop hardness also consists of a diamond square pyramid indenter formed by two unequal opposite angles. The Knoop hardness number (HK) equals the ratio of applied load to the projected contact area. Hardness tests are classified into micro-indentation (microhardness) tests and macro-indentation tests, depending on the force applied to the test material. Micro-indentation tests typically use loads in the range 0.01–2 N (about 1–203 gf); meanwhile, macro-indentation tests use over 10 N (10119 gf)1.
To evaluate features of dental hard tissues in oral diseases, including tooth and alveolar bone, micro-CT (μCT) and scanning electron microscopy (SEM) are used for structural analysis. μCT provides 3D imaging information (volume and mineral density)2, and SEM produces microstructure images (enamel prism and bone lacuna-canalicular)3. Complementarily to structural analysis by μCT and SEM, microhardness is one of the informative parameters to evaluate how structural changes alter the mechanical properties of tooth and alveolar bone in oral diseases, e.g., enamel malformation and periodontal bone resorption. The Vickers microhardness value of human enamel (HV = 283–374) is about 4 to 5 times higher than that of dentin (HV = 53–63)4, 5. In rodent dental fluorosis models, enamel microhardness significantly decreases in mouse incisors treated with fluoride (HV = 136) compared to control enamel (HV = 334)6, 7. This suggests that fluorosed enamel is softer and weaker with lower mineral content and higher protein content than found in non-fluorosed enamel. Microhardness is used to evaluate bone mechanical properties. Several previous studies have examined the mechanical behavior of human bone from different anatomic sites, including long bone microhardness8, 9, 10. The mean microhardness of human fluorosed femurs showed a significant decrease (HV = 222.4) compared to non-fluorosed femurs (HV = 294.4)11. Despite being a useful parameter, there is a scarcity of literature describing microhardness (either Vickers12 or Knoop13, 14) of alveolar bone in oral diseases.
To date, divergent microhardness measurement methods have been reported. Since microhardness values vary15 depending on sample preparation (polishing and flat surface) and indentation site, diverse protocols can cause discrepancies among studies. Standardization of the microhardness testing protocol is essential for consistent and accurate evaluation in oral disease models. In the present study, we demonstrate a standardized protocol for microhardness analysis in tooth and alveolar bone in mouse dental fluorosis model and periodontal bone resorption model.
Protocol
All procedures described in this protocol have been performed in accordance with guidelines and regulations for the use of vertebrate animals approved by the Institutional Animal Care Use Committee (IACUC) at Augusta University and at Nova Southeastern University which is accredited by the Association for Assessment and Accreditation of Laboratory Animal Care International (AAALAC). Note that Dr. Suzuki was employed by Augusta University where the mouse dental fluorosis experiments were completed.
1. Extraction of mandibular incisors in a mouse dental fluorosis model
Feed fluoride-free diets to C57BL/6 mice (5-week-old, male) from 1 week prior to fluoride until termination of fluoride treatment.
Prepare fluoride water by adding NaF in distilled water followed by vacuum filtration using a 0.2 μm filter. Give animals fluoride water as NaF (0 ppm and 125 ppm; N=5/group) ad libitum for 6 weeks. Replace fluoride water with a freshly prepared batch every 2 days.
After 6 weeks of fluoride water treatment, euthanize animals with CO2 followed by decapitation.
Extract the hemi mandibular with incisor from each mouse. To collect the hemi mandibular with incisor, cut the muscles around the mandibular jaw without applying excessive force.
Place the hemi mandibular in PBS and keep it at 4 °C until μ-CT analysis (optional). Separate the incisor from the mandibular using a scalpel (#15) and scissors without damaging or breaking the specimen.
-
Wash the isolated incisor with PBS and perform dehydration by immersing it in increasing strength of alcohol (70% and 100% ethanol) for 2–3 h.
NOTE: If the tissue (e.g., pulp) is not sufficiently dehydrated, resin impregnation is likely to be inhibited and subsequent evaluation will likely be inadequate.
After dehydration with ethanol, embed the incisor horizontally in resin. Continue to step 3.
2. Extraction of maxillary alveolar bones in a mouse ligature-induced periodontal bone resorption (L-PBR) model
Administer 0.8 mL of ketamine (100 mg/mL) + 0.1 mL of Xylazine (100 mg/mL) + 9.1 mL of PBS intraperitoneally (i.p.) to mouse (C57BL/6, 8–12-week-old, male) as anesthetics. The dosage is 0.01 mL/g (weight). Apply ophthalmic ointment to both eyes to prevent dryness under anesthesia.
Place the anesthetized mouse on a heating pad for 5–10 min. Assess responses to tail/toe pinches and the intactness of the ocular reflex. Confirm that the mouse is unresponsive to the noxious stimuli and the reflex is absent.
Place the mouse on the treatment table and keep the mouth open by means of a ligature 5–0 silk suture tied to a magnetic post on the treatment table.
Under a surgical microscope, wind the ligature (Braided silk suture 6–0) around one side of the maxillary second molar (single layer) using micro needle holders. Minimize individual differences in analysis by using one side as the treatment side and the other side as the control.
-
Tie the ligature and make a knot on the palate side. After making a knot, cut the remaining ligature as short as possible so that the excessive ligature does not interfere with chewing or eating. This is important to ensure that the ligature will not loosen by chewing during the subsequent observation period.
NOTE: Do not leave the animal unattended until it has regained sufficient consciousness to maintain sternal recumbency. Do not return the animal that has undergone surgery to the company of other animals until fully recovered. Maintain sterile conditions during survival.
Feed diet and water to mice ad libitum for 2 weeks. After 2 weeks of ligation, euthanize mice with CO2 followed by decapitation.
Extract both side maxillae (ligature side and control side) with molars from each mouse. To collect maxillae with molars, cut the muscles and bone around the maxillary jaw using scissors without applying excessive force. Place each maxilla in PBS and keep it at 4 °C until μCT analysis (optional).
Separate the alveolar bone with molars (1st to 3rd) from the maxilla using a scalpel (#15) and scissors without damaging or breaking the specimen.
-
Wash the isolated alveolar bone with PBS then dehydrate and degrease by immersion in increasing strength of alcohol (70% and 100% ethanol) for 2–3 h.
NOTE: If the tissue (e.g., pulp and bone) is not sufficiently dehydrated, resin impregnation is likely to be inhibited and subsequent evaluation will likely be inadequate.
After dehydration with ethanol, embed the alveolar bone horizontally in resin. Continue to step 3.
- Optional: Perform μCT evaluation before microhardness testing.
- Before microhardness testing, perform nondestructive structural analysis (e.g., μCT) using the same sample for microhardness testing as a complementary evaluation (Figure 1). Structural information (3D image, mineral density, volume) by μCT could support to evaluate sample mechanical properties and quality that may affect microhardness results.
Figure 1: Representative μCT images of enamel in control and fluoride-treated mice incisors.
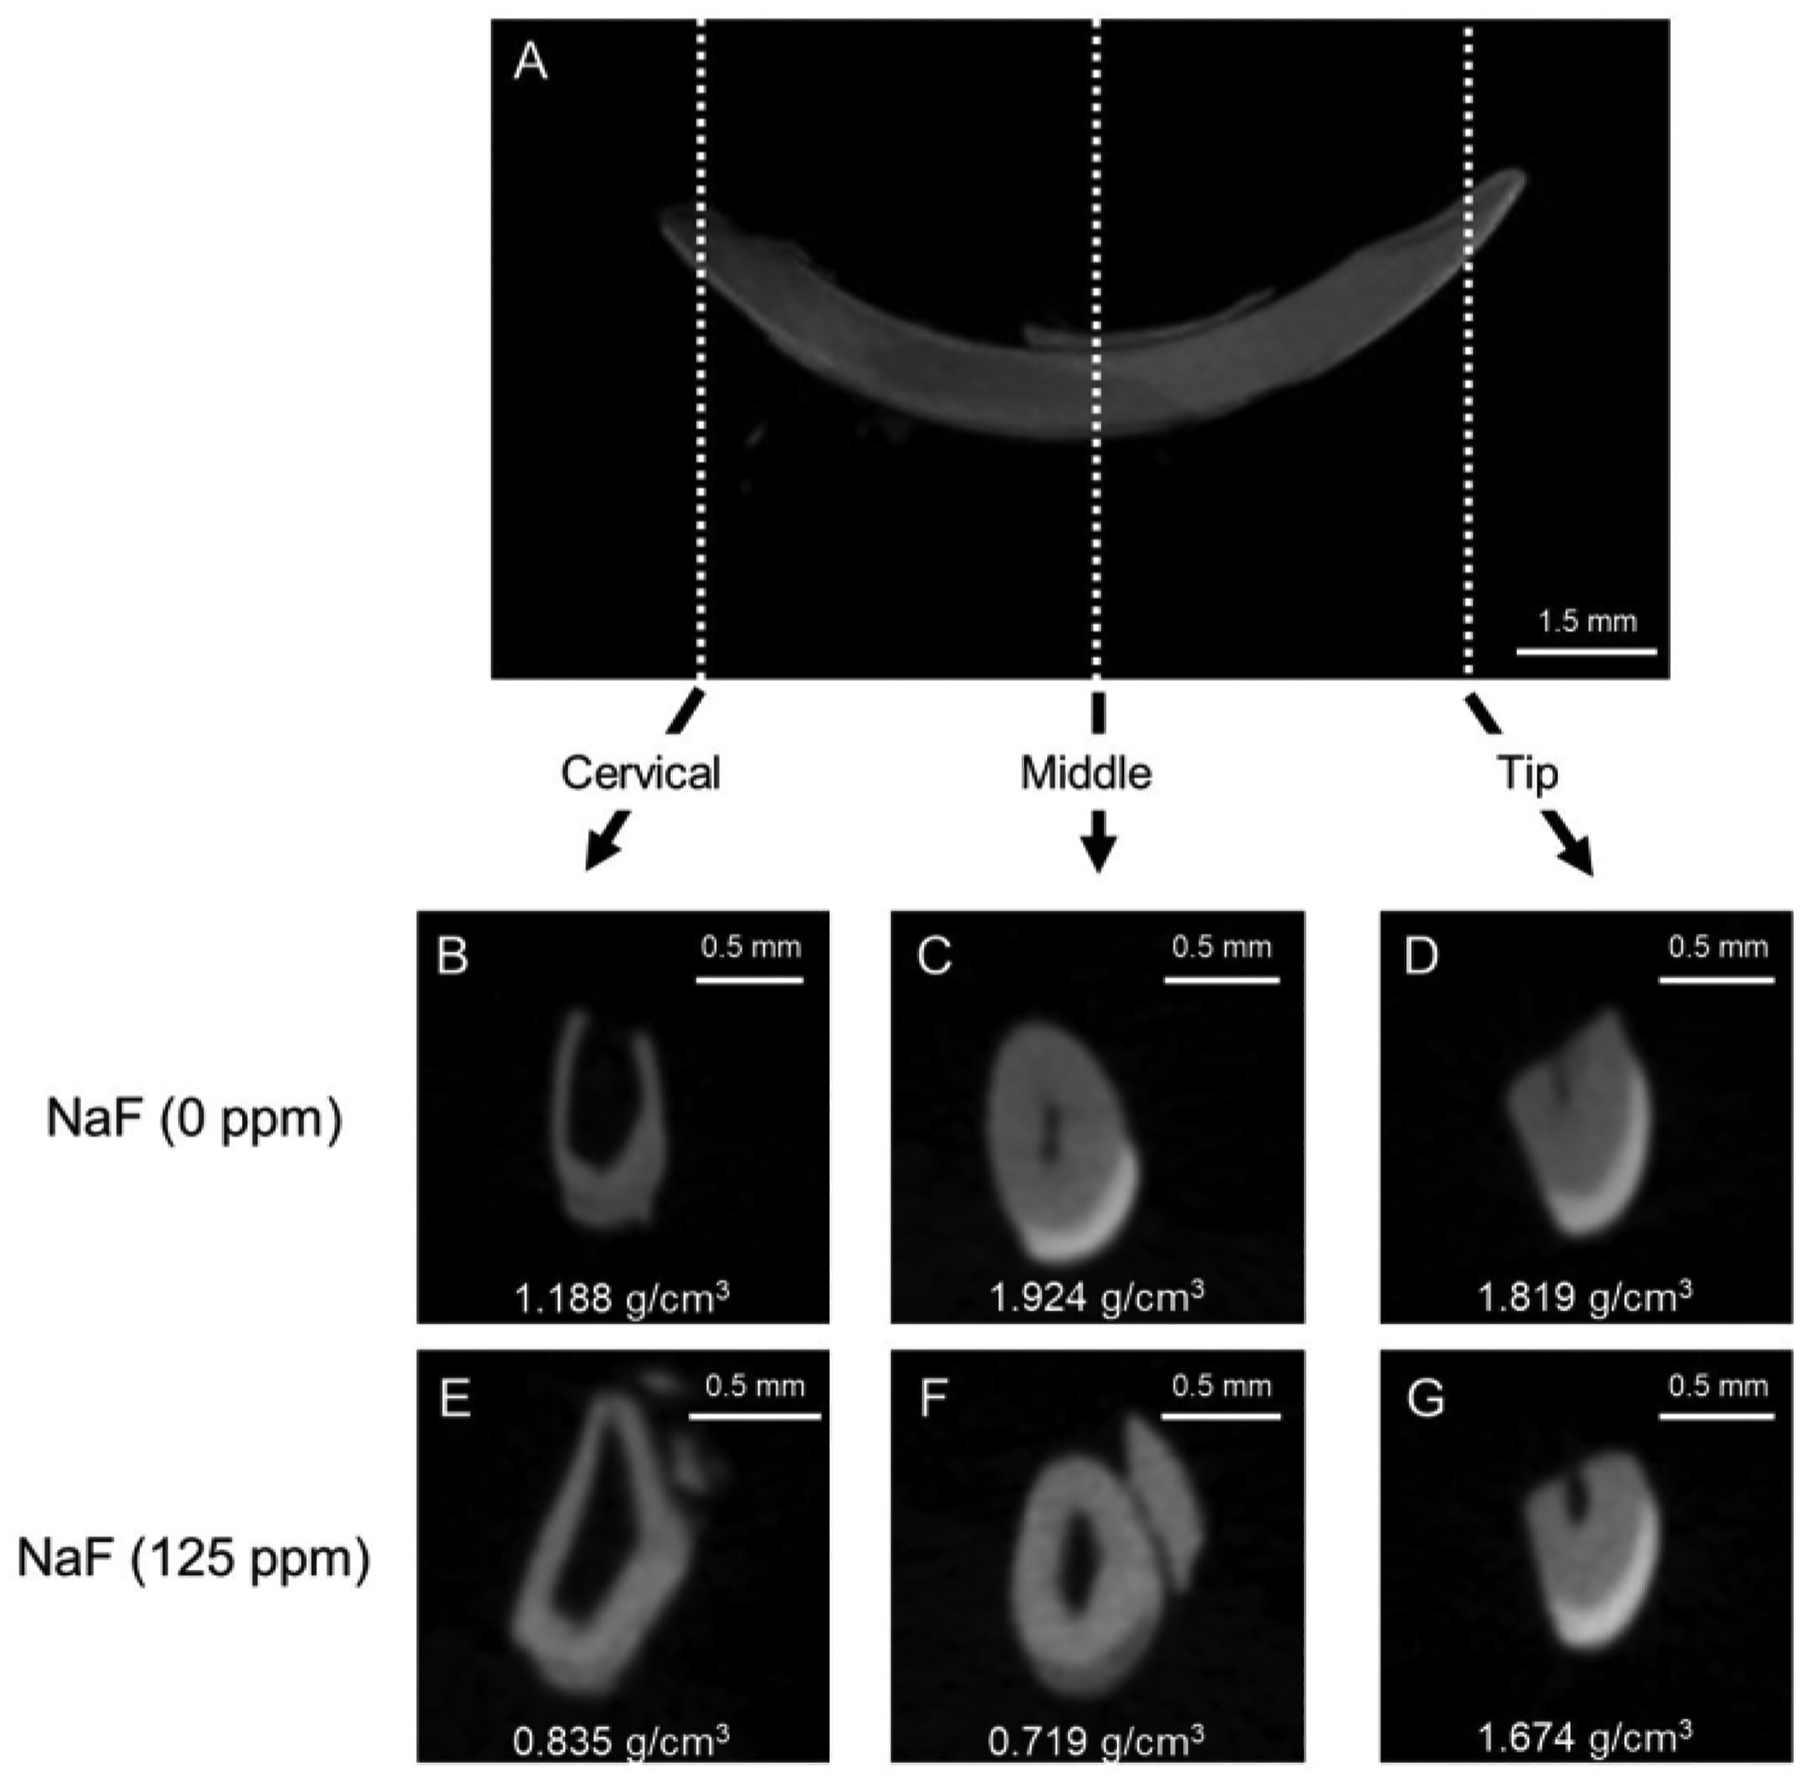
(A) Representative μCT sagittal image of mandibular incisor. (B-D) μCT coronal images of control incisor (NaF 0 ppm). (E-G) μCT coronal images of incisor treated with NaF (125 ppm). Representative enamel mineral density (EMD) is shown (g/cm3).
3. Embedding samples in resin
Continue from step 1.7 (dental fluorosis model) or step 2.10 (L-PBR model).
Coat the inside surface of the mounting cup (1 inch) with a thin layer of petrolatum. Mix resin (cold setting embedding resin) according to instructions. Pour the resin and hardener into the provided plastic cup in a 15:2 volume ratio and carefully mix with a wooden spatula for at least 2 min. Avoid air bubbles.
Place dehydrated and degreased incisor (Figure 2A) or alveolar bone with molars (Figure 2B) oriented horizontally and parallel to the bottom of the mounting cup (1 specimen per cup).
-
Pour the mixed resin (just enough resin, about 1.5 mL) into the mounting cup to completely cover the specimen. Avoid adding more resin than necessary, as excess resin will impede the polishing process (Figure 2C,D). Place the mounting cup containing specimen on a hot plate at 50 °C for at least 8 h to promote resin polymerization. This procedure contributes to holding the specimen in a stable position.
NOTE: Depending on the sample size, adjust the amount of resin to completely cover the specimen. Do not fill too much resin, otherwise more time will be needed to remove superfluous resin.
-
After curing, remove the resin containing the specimen from the mounting cup. Remove burrs and arrange the specimen’s plane and the opposite side plane as parallel and flat using an advanced grinder-polisher with rough water-resistant abrasive paper (Grit 60/P60 and 120/P120) under water flooding. Keep the height of specimen to approximately 3 mm for incisor and alveolar bone (Figure 2E,F).
NOTE: When the specimen is analyzed by SEM following the microhardness measurement, the thickness of the sample should be about 3 mm so that subsequent SEM observation will not be affected. Smaller samples are more difficult to manipulate with the grinder. For the samples intended for microhardness only, the specimen height can increase to about 10–20 mm.
Trim the external shape to make a rectangular solid resin block and round corners (approximately, width 30 mm, length 10 mm for incisor (Figure 2G) and width 10 mm, length 5 mm, for alveolar bone (Figure 2H)) using a precision sectioning saw.
Once the rough shape correction is complete, remove debris and particles from the resin block using an ultrasonic cleaner (about 1 min). Continue to step 4.
Figure 2: Flow of resin-embedding and polishing procedure.
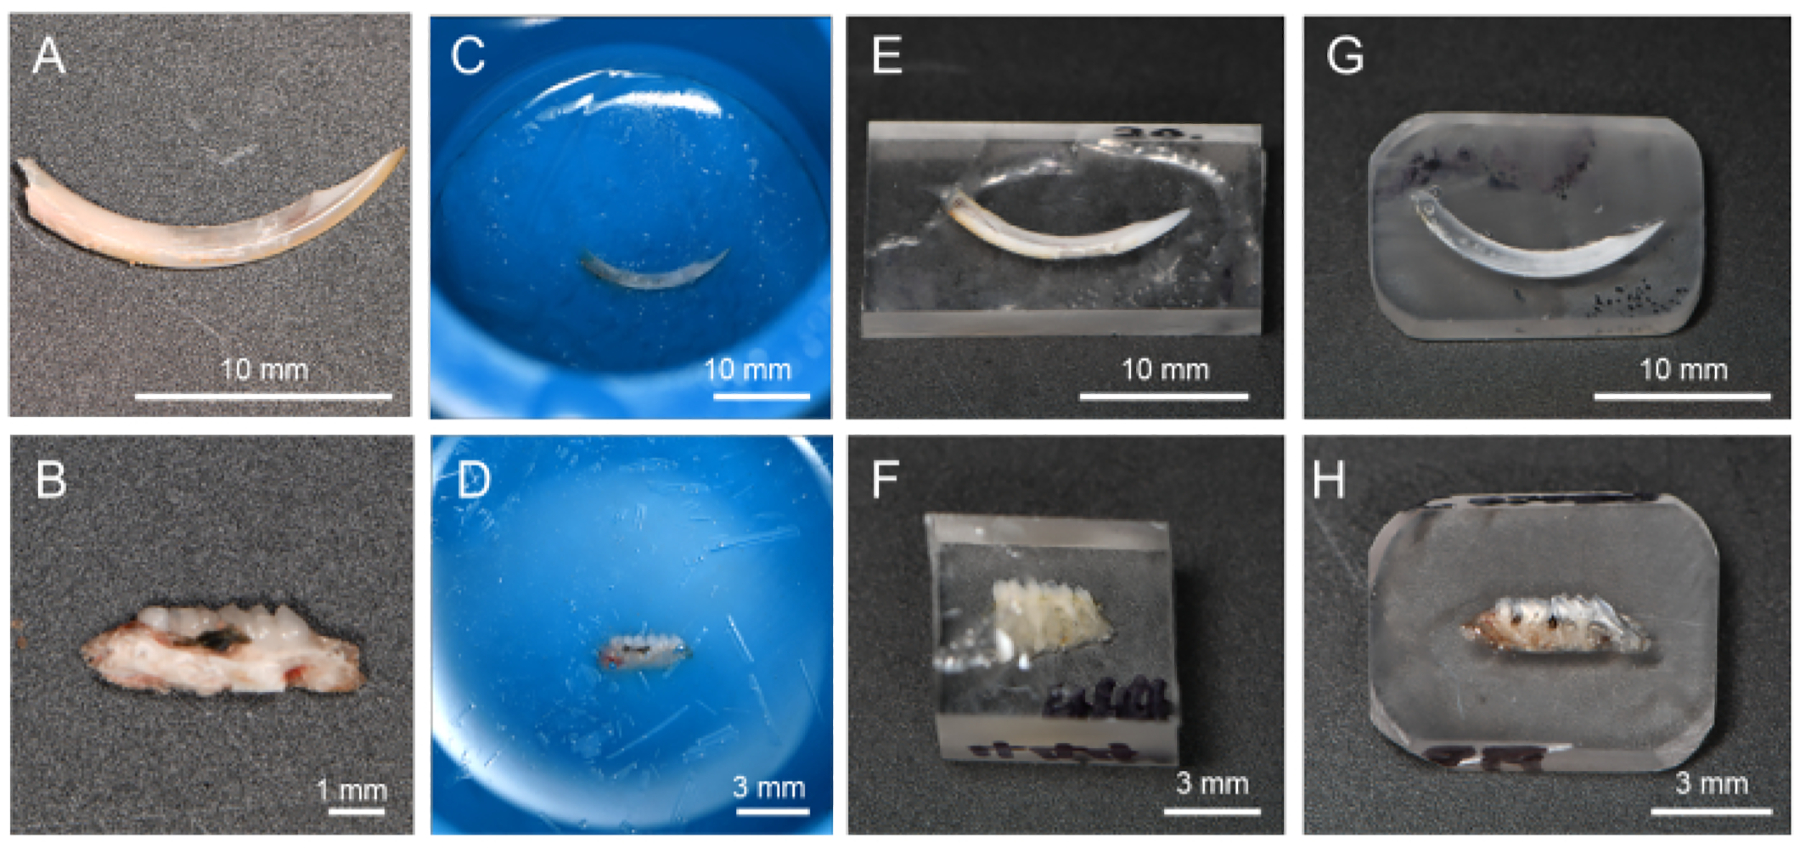
(A) Dehydrated and degreased incisor. (B) Dehydrated and degreased alveolar bone in L-PBR. (C, D) Incisors and alveolar bone immersed in resin. (E, F) By cutting off the resin, it is easier to polish the target tissue surface. (G, H) Resin corners rounded for the polishing process. Abbreviations: L-PBR = ligature-induced periodontal bone resorption.
4. Polishing of specimens
NOTE: Polishing of specimens is done manually using waterproof abrasive papers (from rough to finer) on an advanced grinder-polisher under water flooding.
Place a rough water-resistant abrasive paper (Grit 600/P1200) on the grinder. Place the trimmed and cleaned resin block (from step 3.7) on the rough water-resistant abrasive paper.
-
While pouring water, hold the resin block and polish the specimen’s evaluation surface on the grinder-polisher (Speed 1–10 × g). At this time, be careful to hold the resin block so that the evaluation surface is parallel to the ground. To keep the evaluation surface intact, check the surface with the naked eye or under a microscope.
NOTE: Note that the grinder rotates clockwise, and uniform pressure can lead to an unparallel surface. To obtain a parallel surface, keep the glider rotational speed constant and press the specimen carefully for a few seconds, and then rotate the specimen 180° to press for the same amount of time. Rough abrasive paper may remove not only resin but also specimen.
Change the abrasive paper to the Grit 800/P2400 and place the resin block on it. Repeat step 4.2.
-
Remove debris and particles from the resin block using an ultrasonic cleaner (about 1 min).
NOTE: Before proceeding, using an ultrasonic cleaner to remove any surface debris to prevent clogging is recommended.
Next, perform serial polishing using finer abrasive papers; polishing order is 12 μm, 9 μm, 3 μm, 1 μm and 0.3 μm.
-
Place a lapping film (12 μm) on the grinder-polisher table without rotation and place the resin block on the lapping film.
NOTE: In this experiment, the grinder table is suitable to get a flat surface condition under water flooding. Alternatively, a large plane mirror (or similar one) that provides parallelism can also be used.
Under water cooling, carefully polish the specimen’s evaluation surface on the lapping film by hand. Move the sample vertically, horizontally, and diagonally for the same number of seconds under water injection with strokes of 2 to 3 cm (1 inch). When the polishing procedure is properly achieved, the resin specimen will stick to the lapping film.
Remove debris and particles as in step 4.4. Change the abrasive paper to the next size according to the serial polishing order (from 12 μm to 0.3 μm) and place the resin block on it.
While pouring water, hold the resin block and carefully polish the specimen’s surface on the lapping film by hand. Remove debris and particles as in step 4.4.
Repeat steps 4.5 – 4.8 to complete the final polishing (0.3 μm). After completing the final polishing (0.3 μm), the specimen should have a mirror finish surface (Figure 3A).
Clean the surface of the specimen with ethanol (100%) to degrease and dehydrate and store resin blocks at room temperature until microhardness testing. During storage, avoid excessive moisture and dust. Continue to step 5.
Figure 3: Evaluation regions of microhardness in mandibular incisor.
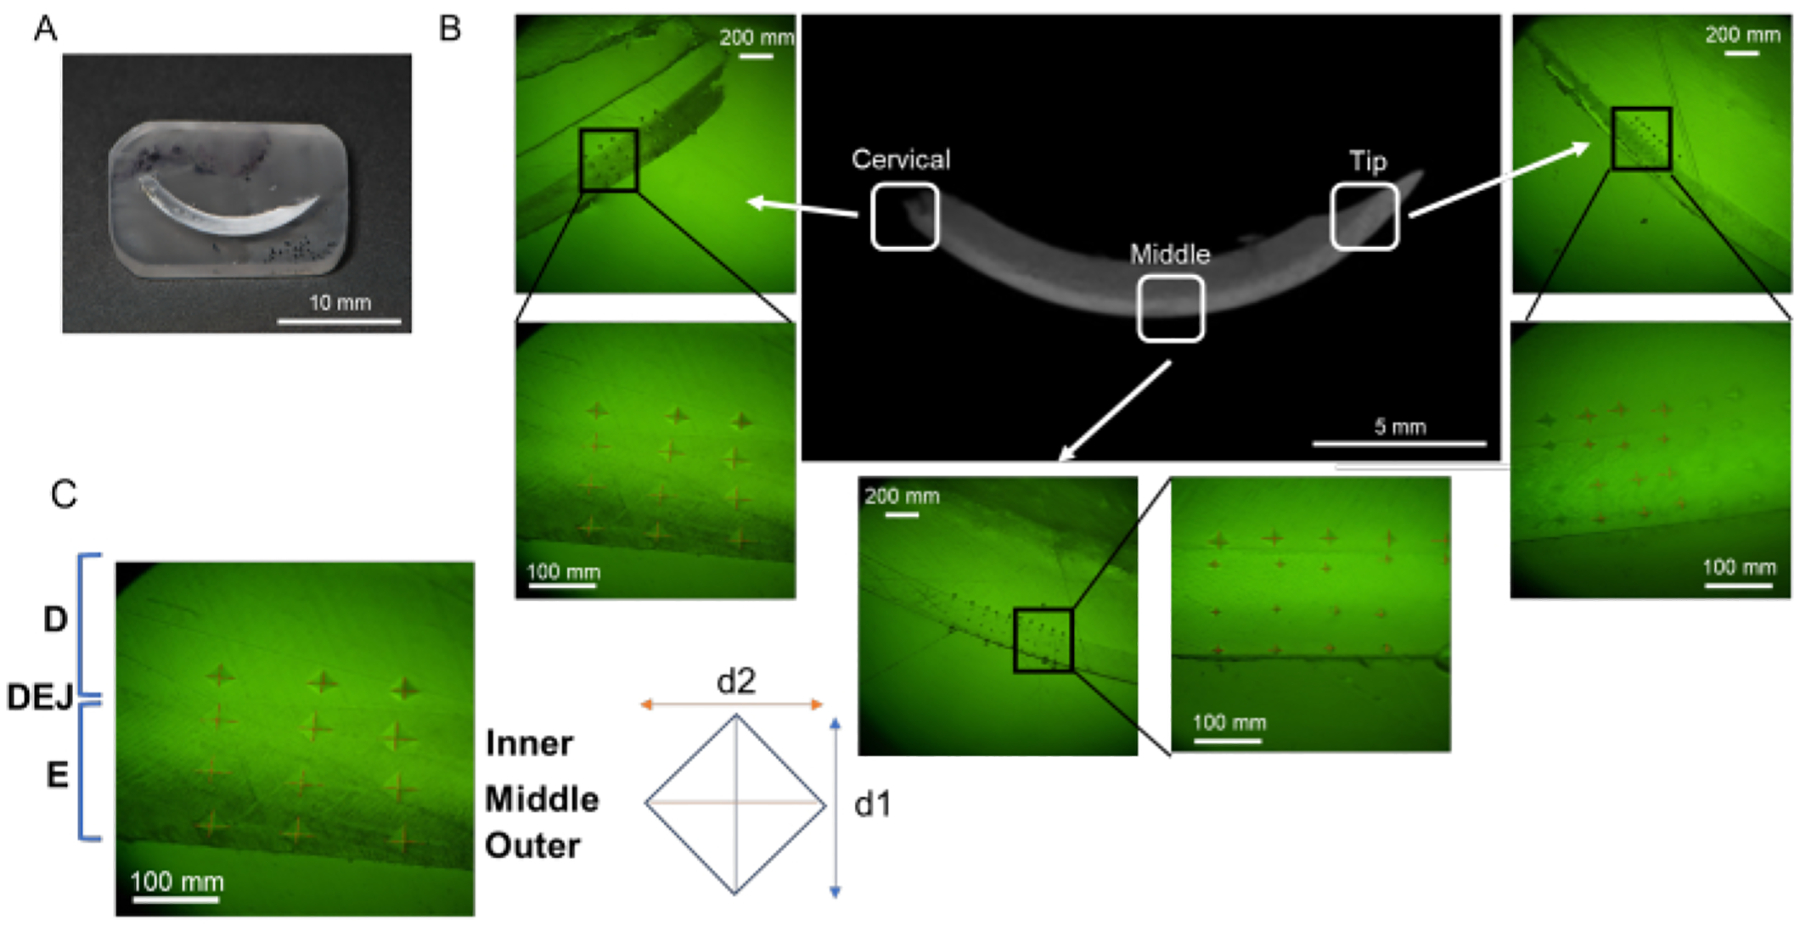
(A) Mirror finish surface sample containing mandibular incisor. (B) Indentations in each region; cervical, middle, and tip (NaF 0 ppm). (C) Three enamel layers; from DEJ, Inner, Middle, and Outer enamel. Abbreviations: D = dentin, E = enamel, DEJ = dentin enamel junction
5. Vickers microhardness test
NOTE: Indentation of a mirror finish surface specimen is done using a microhardness tester. Testing is performed with a load of 25 g for 10 s with a Vickers tip.
-
Vickers microhardness test for incisors (dental fluorosis model)
NOTE: Enamel can be divided into three layers from outside (oral cavity side) to inside (pulp side); namely, the superficial layer, the middle layer, and the deep layer (dentin-enamel junction, DEJ) (Figure 3B)16. In this protocol, three enamel layers are tested.- Set loading force to 25 g and loading duration to 10 s. Place the resin block on the stage.
- Indent 6 points in each enamel layer (superficial, middle and DEJ) and dentine in each region (cervical, middle and tip; Figure 3B).
- Vickers microhardness test for alveolar bone (L-PBR model)
- Set loading force to 25 g and loading duration to 10 s. Place the resin block on the stage.
-
Indent 3–6 points in each mesial and distal side of alveolar bone from the alveolar crest. Indent alveolar bones between 1st and 2nd molar (white square), and 2nd and 3rd molar.NOTE: In this protocol, 6 points in each mesial and distal side (total 12 points) were evaluated for the control (intact) bone, and 3 points in each side (total 6 points) were evaluated for L-PBR. The number of indentation points depends on the conditions of the lesion (e.g., too much bone loss limits the indentation area).
Figure 4: Vickers microhardness of enamel treated with or without NaF.
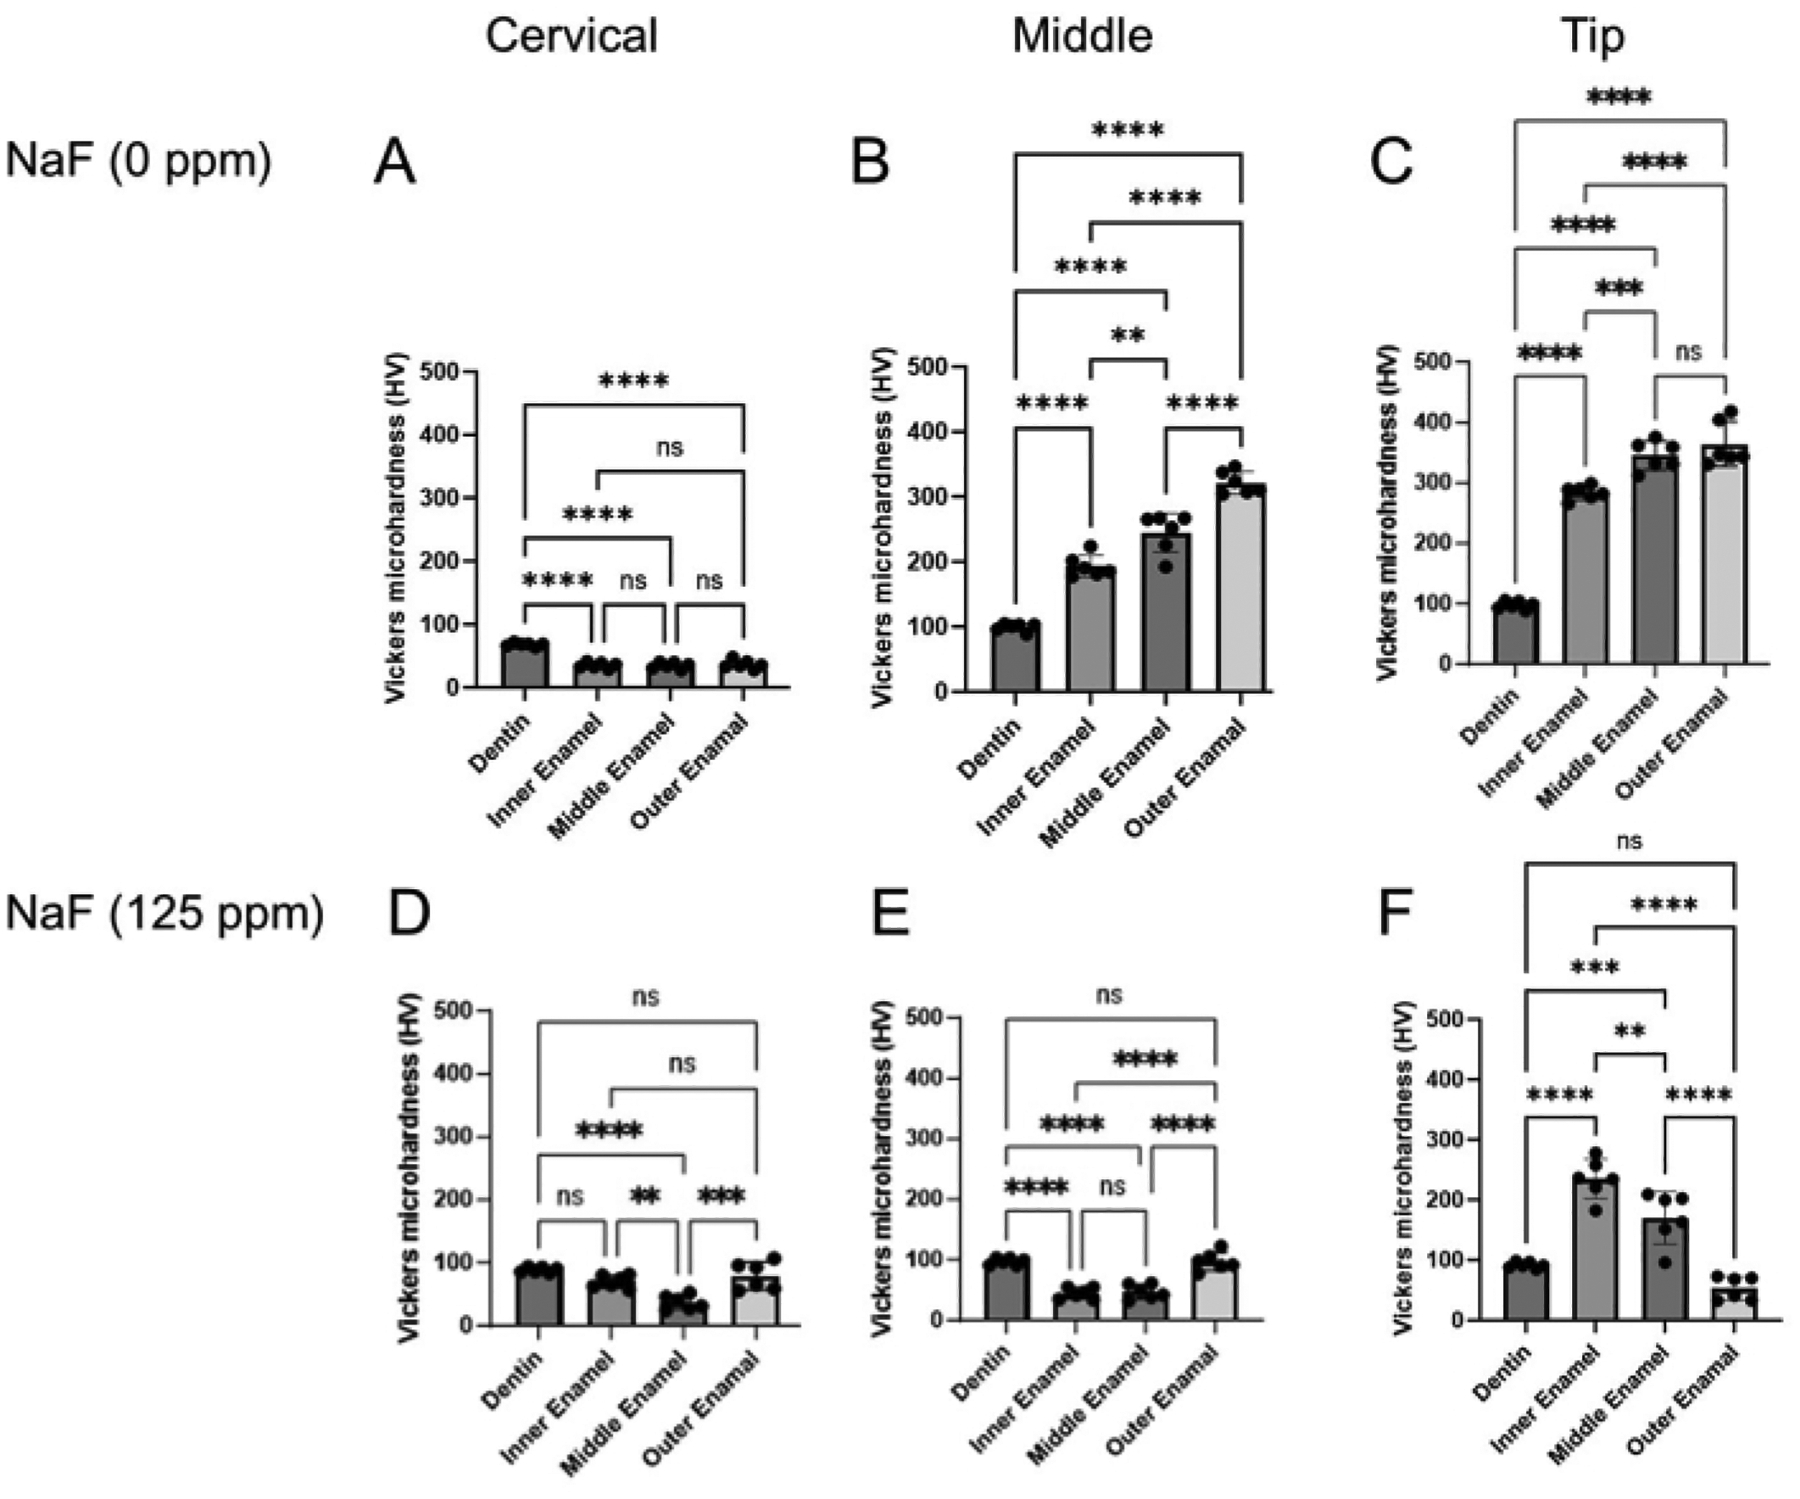
The microhardness of dentin and three enamel layers were evaluated in each region, cervical, middle, and tip region. (A-C) Control and (D-F) NaF (125 ppm) treatment. Data are presented as mean ± SD. Significant differences were evaluated by one-way ANOVA with Tukey’s post-hoc test. p values < 0.05 were considered statistically significant. **p < 0.005, ***p < 0.0005, ****p < 0.0001
Representative Results
Dental fluorosis model: Figure 1 shows representative μCT images of incisors in control and fluoride-treated mice. In the control (Figure 1B–D), the cervical region showed lower enamel mineral density (EMD) of 1.188 g/cm3 (Figure 1B) compared to the middle (1.924 g/cm3) and tip (1.819 g/cm3; Figure 1C,D). In the fluoride-treated enamel (Figure 1E–G), only one sample out of five was evaluated for EMD in the cervical region (0.835 g/cm3; Figure 1E and Supplementary Figure 1). The EMD in all regions decreased compared to the control (Figure 1F,G). The low EMD levels were consistent with the low enamel microhardness values. As shown in Figure 3, six points were indented at dentin and three layers of enamel (inner, middle, and outer) in the cervical, middle, and tip regions. In the control, each enamel layer’s microhardness was lower than dentin in the cervical region (Figure 4A). In the middle and tip regions, enamel microhardness of each layer was significantly higher than that of dentin (Figure 4B,C). Among the three enamel layers, microhardness increased from the inner to the outer enamel in each middle and tip region (Figure 4B,C). Dentin had a microhardness value around 100 HV with small variations in cervical, middle and tip regions, whereas enamel microhardness was significantly different in regions and in enamel three layers. These results suggest that enamel microhardness significantly differs depending on indentation sites (regions and enamel layers). In the fluoride-treated tooth, contrary to the control, enamel microhardness was less than dentin even in the middle region (Figure 4E). In the tip region, microhardness significantly decreased from the inner to the outer enamel layer (Figure 4F). These gradient differences of microhardness among enamel layers are difficult to evaluate by μCT images.
L-PBR model: Figure 5A shows μCT images of alveolar bone in the ligature-induced periodontal bone resorption (L-PBR) model. The representative bone mineral density (BMD) (mean of the mesial and distal sides of alveolar bone around second molar) was 0.76 g/cm3 in control bone and 0.61 g/cm3 in L-PBR. Bone resorption levels were quantified by the distance from the cement enamel junction (CEJ) to the alveolar bone crest (ABC). The CEJ-ABC length was significantly increased in L-PBR compared to the control bone (Figure 5B). Figure 6 shows microhardness indentation sites and corresponding μCT images. From the alveolar bone crest, five indentations were done in each medial and distal side (total 10 sites) in the control bone between 1st and 2nd molar indicated by the white square (Figure 6A). The 3 indentations in each mesial and distal side (total 6 sites) were measured in the L-PBR (Figure 6B). Vickers microhardness values (HV) were the means of indentations of alveolar bones between 1st and 2nd molar (Figure 6B; White square), and between 2nd and 3rd molar (Figure 6B; Blue square). Alveolar bone BMD and HV values showed a lower tendency in L-PBR (affected by periodontal diseases) compared to control (healthy) alveolar bone.
Figure 5: Representative μCT image and bone loss in the L-PBR model.
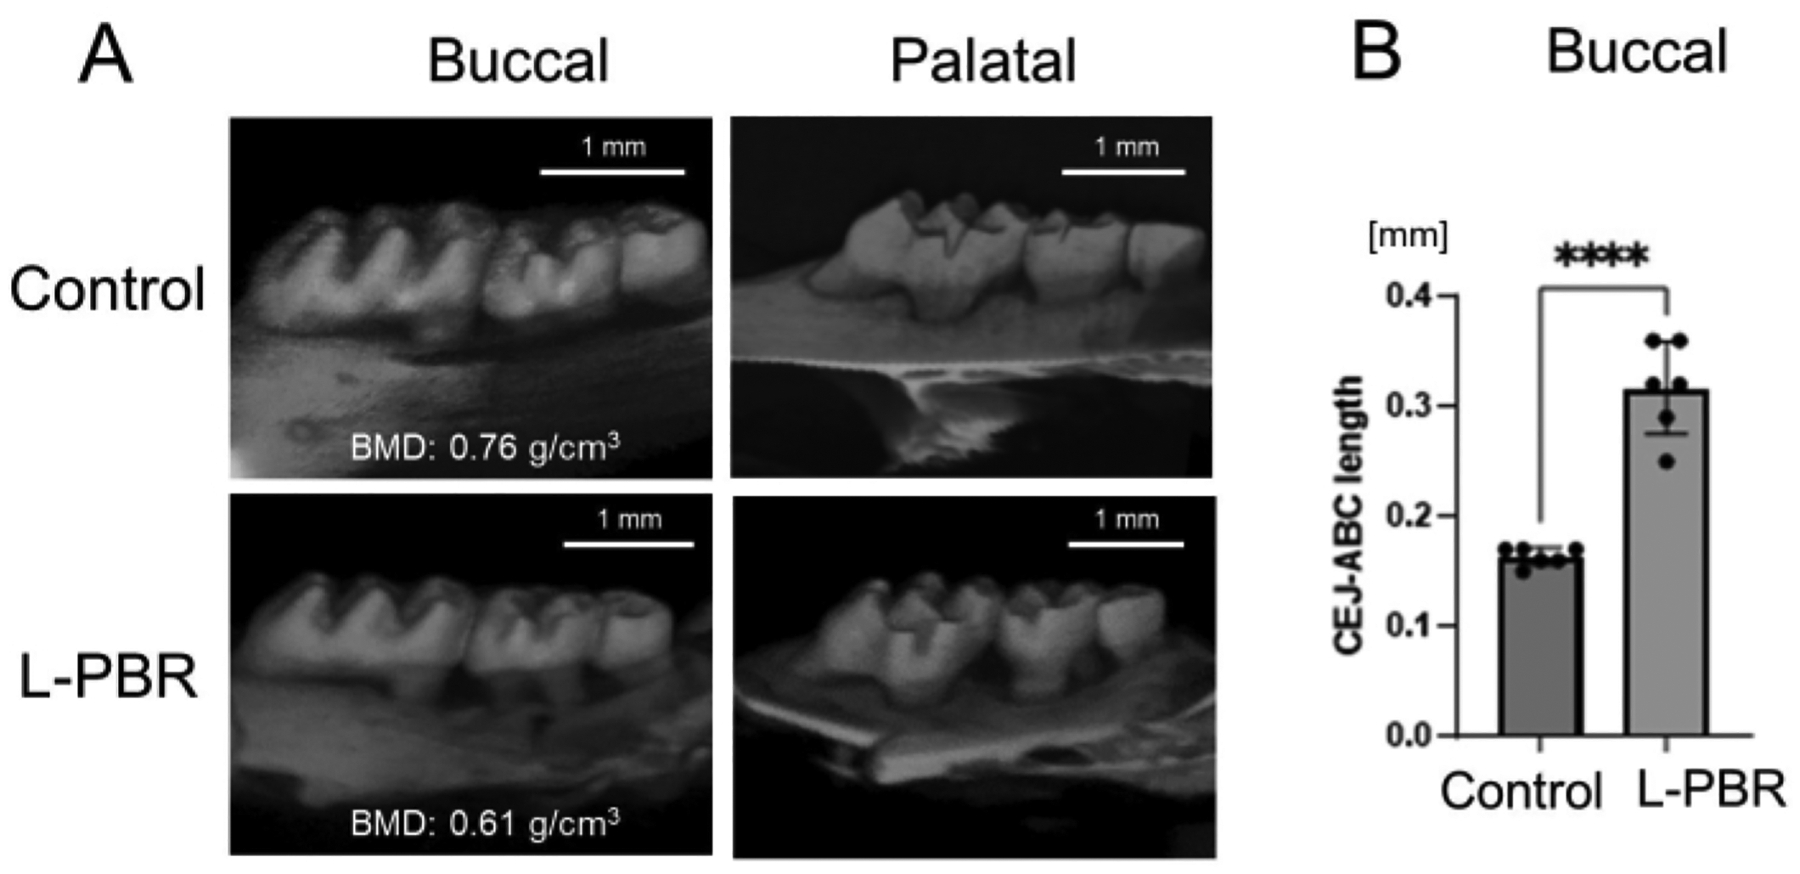
(A) Representative μCT images in the L-PBR model (Control and L-PBR group). The representative bone mineral density (BMD; mean of the mesial and distal sides of alveolar bone around second molar) is shown (g/cm3). (B) Distance from the mesial and distal CEJ of the maxillary second molar to the alveolar bone crest in the root apical direction. Data are presented as mean ± SD. Significant differences were evaluated by t-test. p values < 0.05 were considered statistically significant. **** p < 0.0001. Abbreviations: L-PBR = ligature-induced periodontal bone resorption. CEJ = cement enamel junction, ABC = alveolar bone crest.
Figure 6: Representative microhardness results in the L-PBR model.
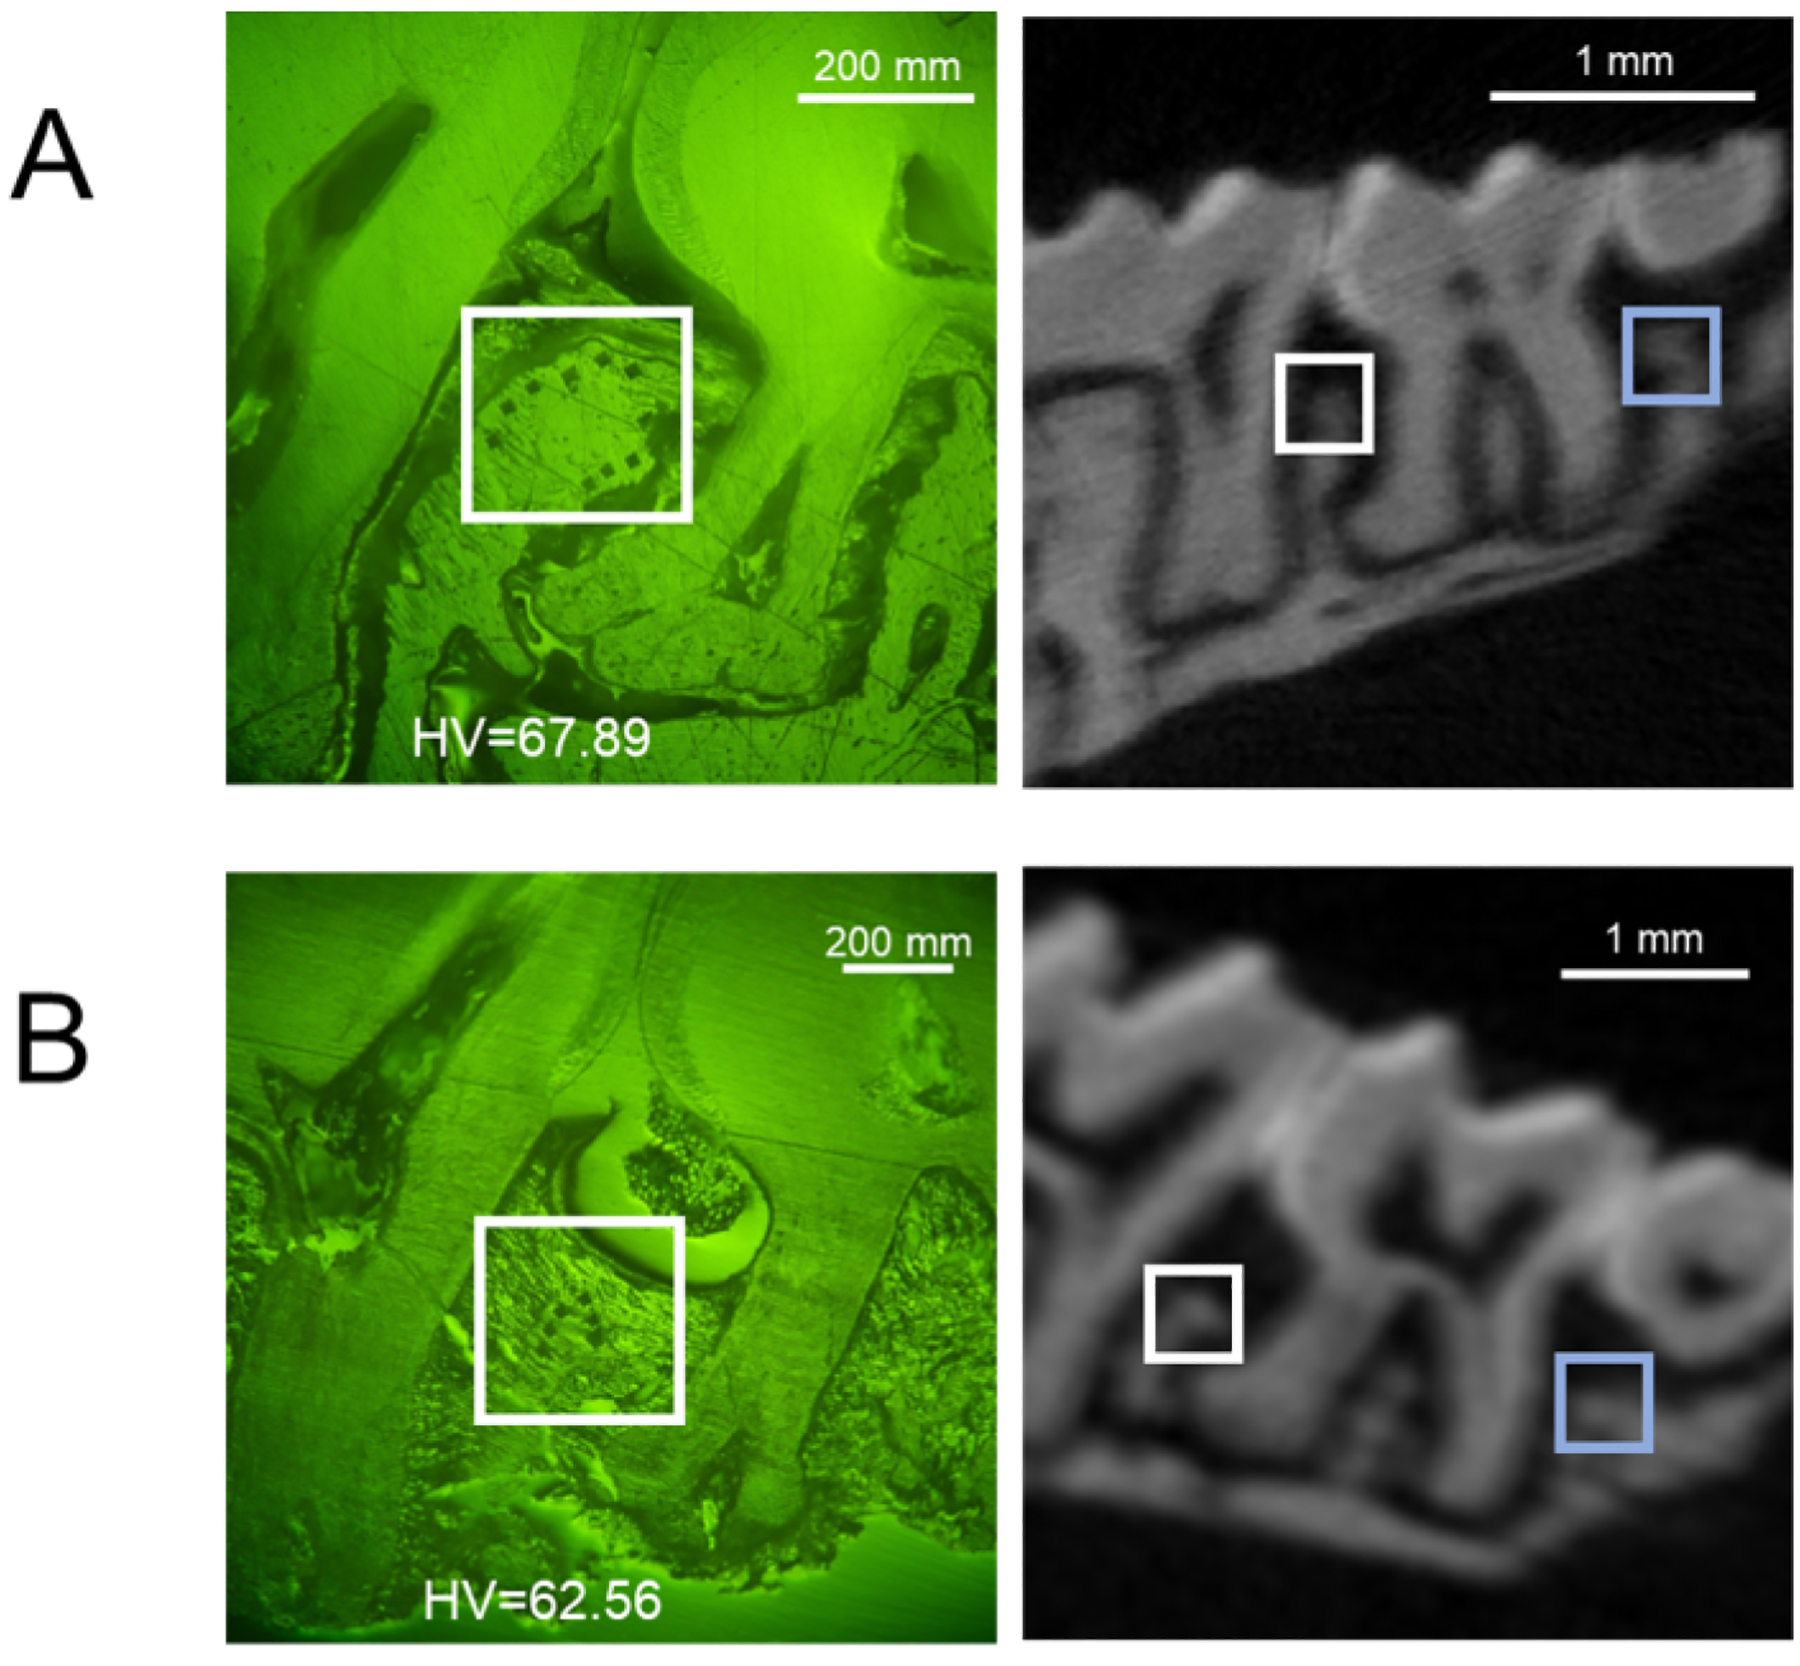
Representative buccal side of indentation sites (left) and the corresponding μCT image (right) of (A) control alveolar bone, and (B) L-PBR. White squares show indentation areas in the alveolar bone between M1 and M2. Blue squares show indentation areas in the alveolar bone between M2 and M3. Microhardness values (HV) are the means of indentations in white and blue square areas. M1: 1st molar, M2: 2nd molar, M3: 3rd molar. Abbreviations: L-PBR = ligature-induced periodontal bone resorption.
Discussion
Microhardness is performed to evaluate mechanical properties of hard tissues like tooth and bone. To date, divergent microhardness measurement methods have been reported. Most of the measurement information, especially sample preparations and the indentation sites are likely to be insufficient. This study focused on the microhardness protocol for enamel and alveolar bone in dental fluorosis and periodontal diseases models. To obtain consistent and accurate results, the critical steps in this protocol are orientation of the specimen in resin embedding, keeping the evaluation surface parallel to the ground, serial polishing of evaluation surface to obtain mirror finish, and indentation regions and sites set by reference point. During the resin embedding and polishing procedures, it is important to check that the evaluation surface is consistently parallel to the ground and the surface is intact by eye or under a microscope. Although it is optional, μCT analysis is encouraged to determine indentation sites.
In the dental fluorosis model, NaF (125 ppm) treatment made it difficult to identify enamel structure from the cervical to middle regions by μCT. Only the tip region enamel could be distinguished from dentin (Figure 1 and Supplementary Figure 1). Therefore, to evaluate enamel microhardness in the dental fluorosis model, the tip region indentation is appropriate. In accordance, previous studies evaluated the tip region of incisor enamel in dental fluorosis models6, 7. In the periodontal disease model, 3D observation by μCT helps identify the bone resorption on both buccal and palatal sides (Figure 5). This is critical for understanding the amount of bone loss and the anatomical position of the alveolar bone to determine consistent indentation sites for microhardness.
A previous study demonstrated a positive correlation between microhardness and mineral density17. Our results of EMD by μCT and enamel microhardness (HV; Figure 1 and Figure 4) are concordant with the study. These results suggest that the approximate tendency of microhardness can be anticipated by μCT non-destructively. However, the gradient microhardness differences among the enamel three layers (Figure 4B,C,F) are difficult to identify as EMD gradients by μCT analysis. In this regard, microhardness testing could be considered higher resolution than μCT to clarify pathological conditions. Also, this protocol can be applied to other dental hard tissues, including dentin. Using the same specimen, multifaceted evaluation (SEM, SEM-EDX, micro-XRF and Raman spectroscopy) can be incorporated into the experimental flow prior to microhardness indentations18. Since indentations damage samples, start with a non-destructive test.
One of the critical limitations of microhardness testing is that the value tends to be affected by several factors during sample preparation and indentation. To minimize subjective factors, it is necessary to optimize indentation sites and to standardize measurement protocols that are appropriate for each pathological condition or disease model. In this study, we demonstrated an enamel microhardness protocol for a dental fluorosis model. However, modification and/or optimization of the protocol may be necessary for other enamel hypoplasia, e.g., amelogenesis imperfecta (AI) model because pathology differs in each disease model. In the periodontal disease model, alveolar bone is the main target tissue. L-PBR models are highly applicable in terms of the application of genetic modification techniques in mice. To date, many studies on L-PBR models have been published19, 20. However, to the best of our knowledge, none of the studies has ever addressed microhardness of alveolar bone in mouse periodontal disease models. This can be attributed to several factors. The relationship between alveolar bone microhardness and periodontal disease is not yet clear. The microhardness test is technically difficult to perform in the mouse alveolar bone, especially in bone resorption lesions (because of difficulties to set indentation sites due to bone destruction). It is reasonable to assume that the latter is the factor why microhardness has not been evaluated in periodontal disease models, despite microhardness value is validated as a mechanical parameter in femur and other bones21. This standardized protocol can evaluate the mechanical properties of alveolar bone affected by periodontal disease and/or disease recovery model.
In this report, we demonstrate the standardized protocol to evaluate enamel and alveolar bone microhardness in a mouse oral disease model. This opens the door for future evaluation of enamel and periodontal bone loss/regeneration to develop novel preventive and therapeutic strategies for enamel malformation and periodontal disease.
Supplementary Material
Supplementary Figure 1: μCT image of enamel treated with NaF (coronal section). NaF (125 ppm) caused enamel hypo-mineralization, which was significantly observed in the cervical and middle regions. Only one sample (sample no. 1) out of five barely showed enamel in the cervical and middle regions.
Acknowledgments
Research reported in this publication was supported by JSPS KAKENHI JP21K09915 (MO) and the National Institute of General Medical Sciences; T34GM145509 (MM) and the National Institute of Dental and Craniofacial Research; R01DE025255 and R21DE032156 (XH); R01DE029709, R21DE028715 and R15DE027851 (TK); R01DE027648 and K02DE029531 (MS).
Footnotes
A complete version of this article that includes the video component is available at http://dx.doi.org/10.3791/66583.
Disclosures
The authors declare no conflict of interest.
References
- 1.Broitman E Indentation hardness measurements at macro-, micro-, and nanoscale: A critical overview. Tribol Lett. 65 (1), 23 (2017). [Google Scholar]
- 2.Lee MJ et al. Sirt6 activation ameliorates inflammatory bone loss in ligature-induced periodontitis in mice. Int J Mol Sci. 24 (13), 10714 (2023). [DOI] [PMC free article] [PubMed] [Google Scholar]
- 3.Min J et al. Investigation on the gradient nanomechanical behavior of dental fluorosis enamel. Nanoscale Res Lett. 13 (1), 347 (2018). [DOI] [PMC free article] [PubMed] [Google Scholar]
- 4.Craig RG Peyton, F. A. The micro-hardness of enamel and dentin. J Dent Res. 37 (4), 661–668 (1958). [DOI] [PubMed] [Google Scholar]
- 5.Chun K, Choi H, Lee J Comparison of mechanical property and role between enamel and dentin in the human teeth. J Dent Biomech. 5, 1758736014520809 (2014). [DOI] [PMC free article] [PubMed] [Google Scholar]
- 6.Suzuki M, Everett ET, Whitford GM, Bartlett JD 4-phenylbutyrate mitigates fluoride-induced cytotoxicity in alc cells. Front Physiol. 8, 302 (2017). [DOI] [PMC free article] [PubMed] [Google Scholar]
- 7.Sharma R et al. Assessment of dental fluorosis in mmp20 +/− mice. J Dent Res. 90 (6), 788–792 (2011). [DOI] [PMC free article] [PubMed] [Google Scholar]
- 8.Wu WW et al. Bone hardness of different anatomical regions of human radius and its impact on the pullout strength of screws. Orthop Surg. 11 (2), 270–276 (2019). [DOI] [PMC free article] [PubMed] [Google Scholar]
- 9.Li S et al. Atlas of human skeleton hardness obtained using the micro-indentation technique. Orthop Surg. 13 (4), 1417–1422 (2021). [DOI] [PMC free article] [PubMed] [Google Scholar]
- 10.Ibrahim A et al. Hardness, an important indicator of bone quality, and the role of collagen in bone hardness. J Funct Biomater. 11 (4), 85 (2020). [DOI] [PMC free article] [PubMed] [Google Scholar]
- 11.Vandana KL, Srishti Raj B, Desai R Dental fluorosis and periodontium: An original research report of in vitro and in vivo institutional studies. Biol Trace Elem Res. 199 (10), 3579–3592 (2021). [DOI] [PubMed] [Google Scholar]
- 12.Xia PF et al. Microcarriers containing “hypoxia-engine” for simultaneous enhanced osteogenesis and angiogenesis. Chemical Engineering Journal. 456, 141014 (2023). [Google Scholar]
- 13.Chiu R et al. Effects of biglycan on physico-chemical properties of ligament-mineralized tissue attachment sites. Arch Oral Biol. 57 (2), 177–187 (2012). [DOI] [PubMed] [Google Scholar]
- 14.Leong NL et al. Age-related adaptation of bone-pdl-tooth complex: Rattus-norvegicus as a model system. PLoS One. 7 (4), e35980 (2012). [DOI] [PMC free article] [PubMed] [Google Scholar]
- 15.Johnson WM Rapoff AJ Microindentation in bone: Hardness variation with five independent variables. J Mater Sci Mater Med. 18 (4), 591–597 (2007). [DOI] [PubMed] [Google Scholar]
- 16.Kweon YS et al. Effects of fam83h overexpression on enamel and dentine formation. Arch Oral Biol. 58 (9), 1148–1154 (2013). [DOI] [PMC free article] [PubMed] [Google Scholar]
- 17.Boivin G et al. The role of mineralization and organic matrix in the microhardness of bone tissue from controls and osteoporotic patients. Bone. 43 (3), 532–538 (2008). [DOI] [PubMed] [Google Scholar]
- 18.Okamoto M et al. Microstructural evaluation of the mineralized apical barrier induced by a calcium hydroxide paste containing iodoform: A case report. J Endod. 50 (2), 243–251 (2024). [DOI] [PubMed] [Google Scholar]
- 19.Wang Y et al. B10 cells alleviate periodontal bone loss in experimental periodontitis. Infect Immun. 85 (9), e00335–17 (2017). [DOI] [PMC free article] [PubMed] [Google Scholar]
- 20.Chen Y et al. Nlrp3 regulates alveolar bone loss in ligature-induced periodontitis by promoting osteoclastic differentiation. Cell Prolif. 54 (2), e12973 (2021). [DOI] [PMC free article] [PubMed] [Google Scholar]
- 21.Robinson JW et al. Male mice with elevated c-type natriuretic peptide-dependent guanylyl cyclase-b activity have increased osteoblasts, bone mass and bone strength. Bone. 135, 115320 (2020). [DOI] [PubMed] [Google Scholar]
Associated Data
This section collects any data citations, data availability statements, or supplementary materials included in this article.
Supplementary Materials
Supplementary Figure 1: μCT image of enamel treated with NaF (coronal section). NaF (125 ppm) caused enamel hypo-mineralization, which was significantly observed in the cervical and middle regions. Only one sample (sample no. 1) out of five barely showed enamel in the cervical and middle regions.


