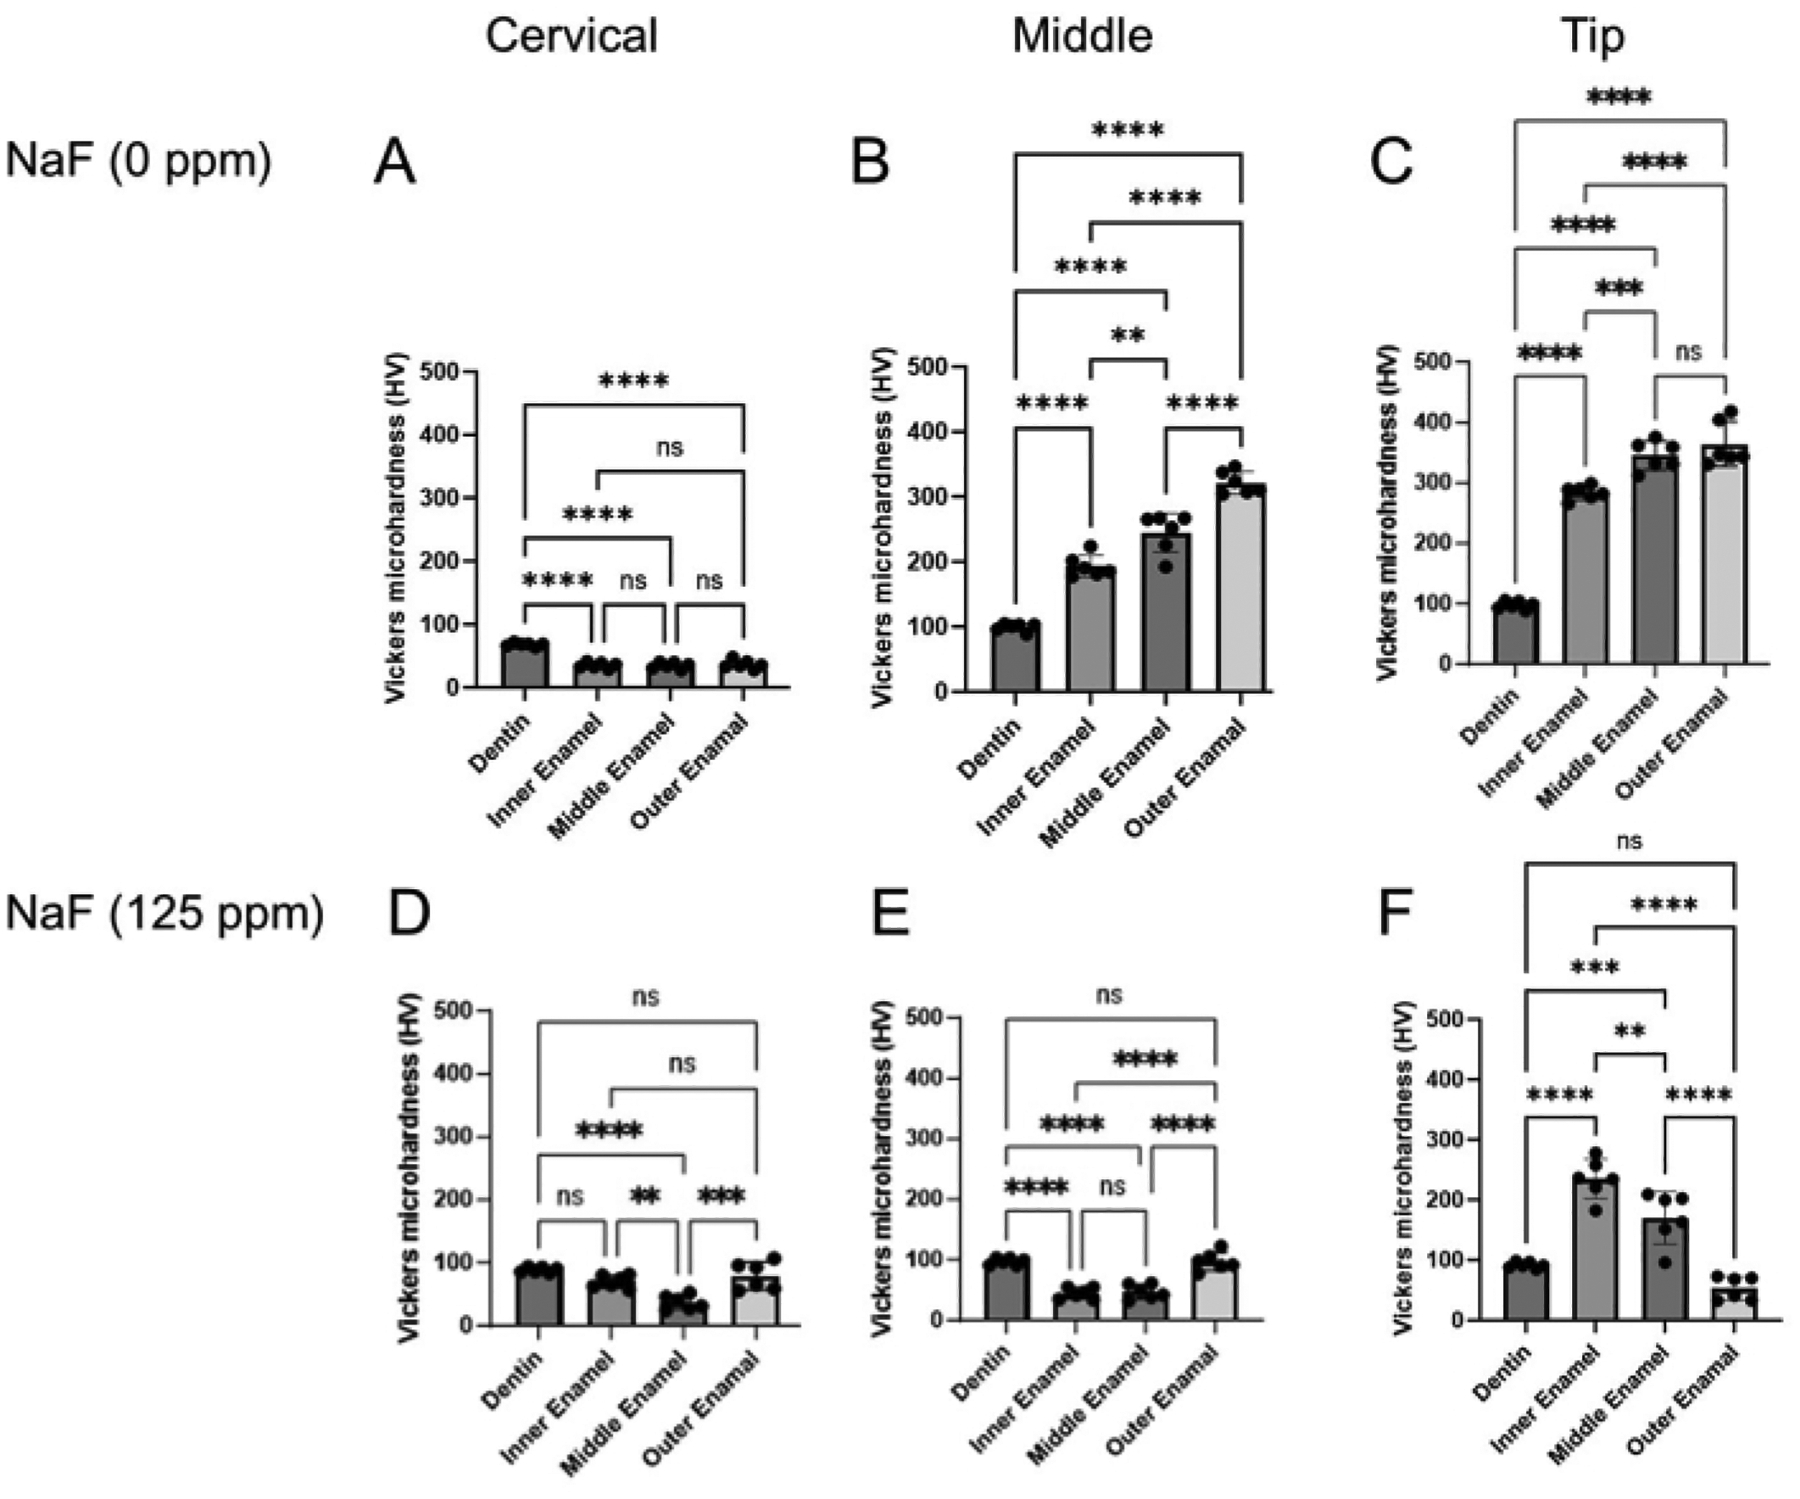
Figure 4: Vickers microhardness of enamel treated with or without NaF.

The microhardness of dentin and three enamel layers were evaluated in each region, cervical, middle, and tip region. (A-C) Control and (D-F) NaF (125 ppm) treatment. Data are presented as mean ± SD. Significant differences were evaluated by one-way ANOVA with Tukey’s post-hoc test. p values < 0.05 were considered statistically significant. **p < 0.005, ***p < 0.0005, ****p < 0.0001
