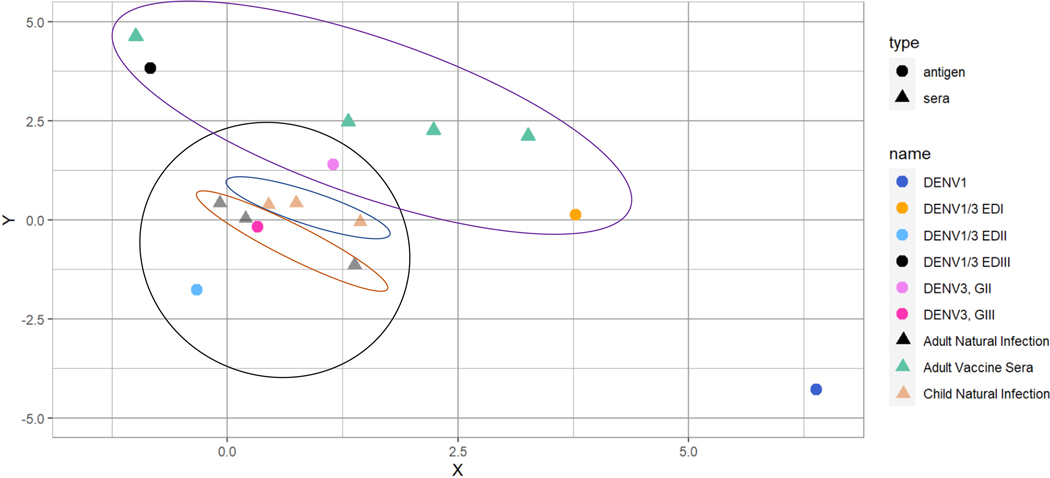
Figure 7. Cartography reveals distinct clusters of natural infection and vaccine serum responses.
Antigenic cartography of the DENV wild-type and recombinant viruses and serum ID50s are depicted using the Smith et al. method. Viruses are shown as circles and serum samples are shown as triangles, corresponding to the colored key on the right. Convalescent sera are grouped together in the black circle, and further separated into pediatric sera (blue oval) and adult sera (rust colored oval). Vaccine sera are grouped together in the purple oval. Each grid box represents a 2-fold change in titer.

