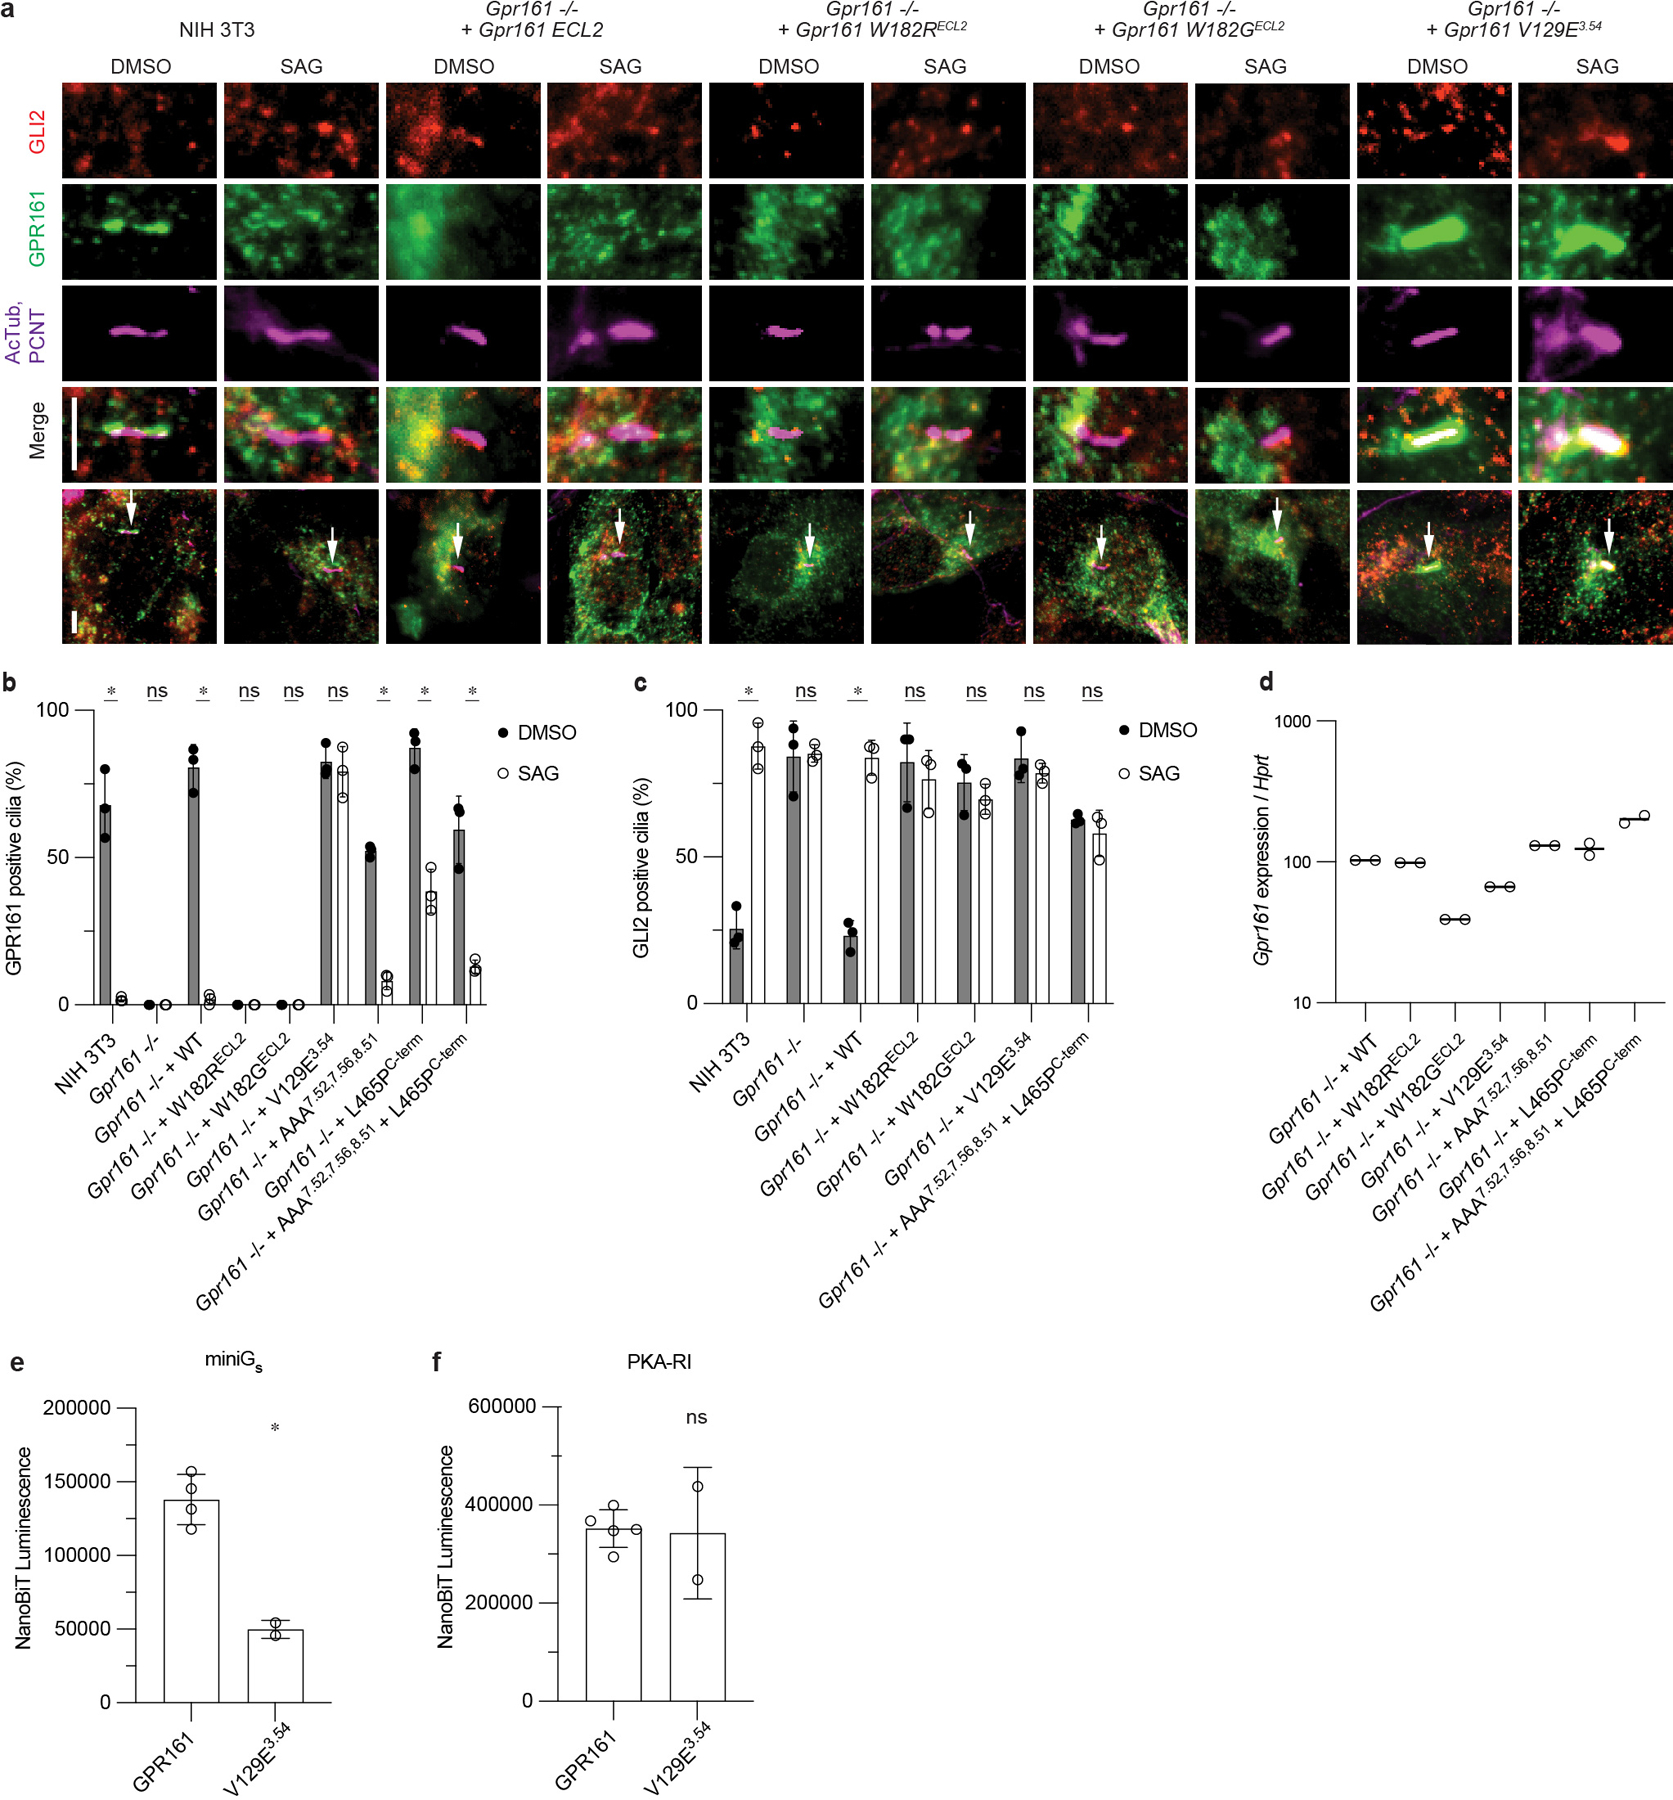
Extended Data Fig. 9. GPR161 localization and repression of GLI2 ciliary trafficking.

a) Representative images of GPR161 mutants on ciliary localization and GLI2 repression in ciliary tips in NIH 3T3 cells. NIH 3T3 Flp-In CRISPR based Gpr161−/− cells stably expressing untagged mouse wild-type or Gpr161 mutants were starved for 24 hr upon confluence and were treated for further 24 hr ± SAG (500 nM). After fixation, cells were immunostained with anti-GLI2 (red), anti-GPR161 (green), anti-acetylated, and centrosome (AcTub; PCNT purple) antibodies. Whole cell images with an arrow indicating imaged cilia. Scale bar, 5 µm. b) Quantification of GPR161 positive cilia indicating trafficking and egress of GPR161 from cilia in the pathway off and on state, respectively. ECL2 mutants do not traffic to cilia suggesting impaired biogenesis. GPR161-V129E3.54 does not egress from cilia following pathway activation and GPR161-L465PC-term has reduced egress compared to GPR161. (*P < 0.05; ns, not significant; two-way ANOVA followed by Šidák’s multiple comparison tests; Adjusted P values for DMSO vs. SAG: NIH3T3, Gpr161−/− +WT, +AAA7.52, 7.56, 8.51, +L465PC-term, + AAA7.52, 7.56, 8.51 L465PC-term=<0.0001, Gpr161−/− , Gpr161−/− + W182RECL2, +W182GECL2=>0.9999, Gpr161−/− + V129E3.54=0.997) c) Quantification GLI2 positive cilia indicating Hedgehog pathway activation. ECL2 mutants and GPR161-V129E3.54 do not rescue, similar to Gpr161−/−. For b,c, data are shown from n=3 independent experiments from images taken from 2–3 different regions/experiment and counting 15–30 cells/region. Data are mean ± s.d. (*P < 0.05; ns, not significant; two-way ANOVA followed by Šidák’s multiple comparison tests; Adjusted P values for DMSO vs. SAG: NIH3T3, Gpr161−/− + WT = <0.0001, Gpr161−/− = >0.9999, Gpr161−/− + W182RECL2= 0.9705, Gpr161−/− + W182GECL2= 0.9724, Gpr161−/− + V129E3.54= 0.9882, Gpr161−/− + AAA7.52, 7.56, 8.51 + L465PC-term= 0.9917). d) Transcript abundance of wild-type and mutant Gpr161 constructs stably expressed in Gpr161−/− NIH3T3 cells quantified by quantitative RT-PCR. e) GPR161-V129E3.54 has reduced recruitment of miniGs compared to WT. Nanoluc complementation assay for receptor recruitment of miniGs. Data are mean ± s.d., n=2 (for V129E3.54) or n =4 (for GPR161) biologically independent samples (*P < 0.05; ns, not significant; Unpaired two-tailed t test with Welch's correction; Adjusted P value: GPR161 vs. V129E3.54=0.0008). f) GPR161-V129E3.54 has similar recruitment of PKA-RI compared to GPR161. Nanoluc complementation assay for receptor recruitment of PKA-RI. Data are mean ± s.d., n=2 (for V129E3.54) or n=5 (for GPR161) biologically independent samples (*P < 0.05; ns, not significant; Unpaired two-tailed t test with Welch's correction; Adjusted P value: GPR161 vs. V129E3.54=0.9406).
