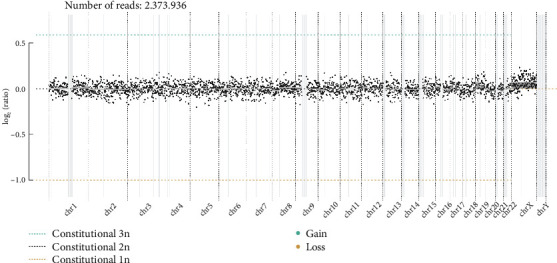
Figure 3.

Normal fetal karyotype predicted by WisecondorX. Plot provides a detailed visualization of chromosomal aneuploidies by plotting data in 1-Mb bins. Each dot's vertical position on the graph represents the log2-transformed ratio of observed to expected reads, indicating chromosomal stability or anomalies. Dot size reflects the certainty of each observation, while segments with varying line widths represent areas of predicted equal copy number, aiding in the detection and analysis of specific chromosomal variations.
