Figure 6.

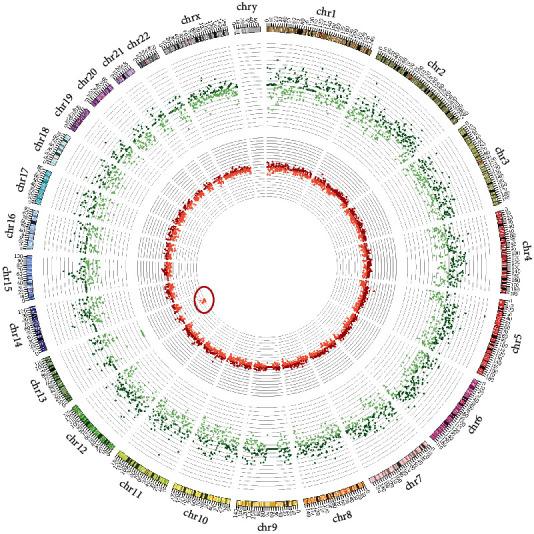
Circos plot displaying z-scores in the inner part and log ratios in the outer ring for each chromosome in a sample with a deletion on chromosome 13.

Circos plot displaying z-scores in the inner part and log ratios in the outer ring for each chromosome in a sample with a deletion on chromosome 13.