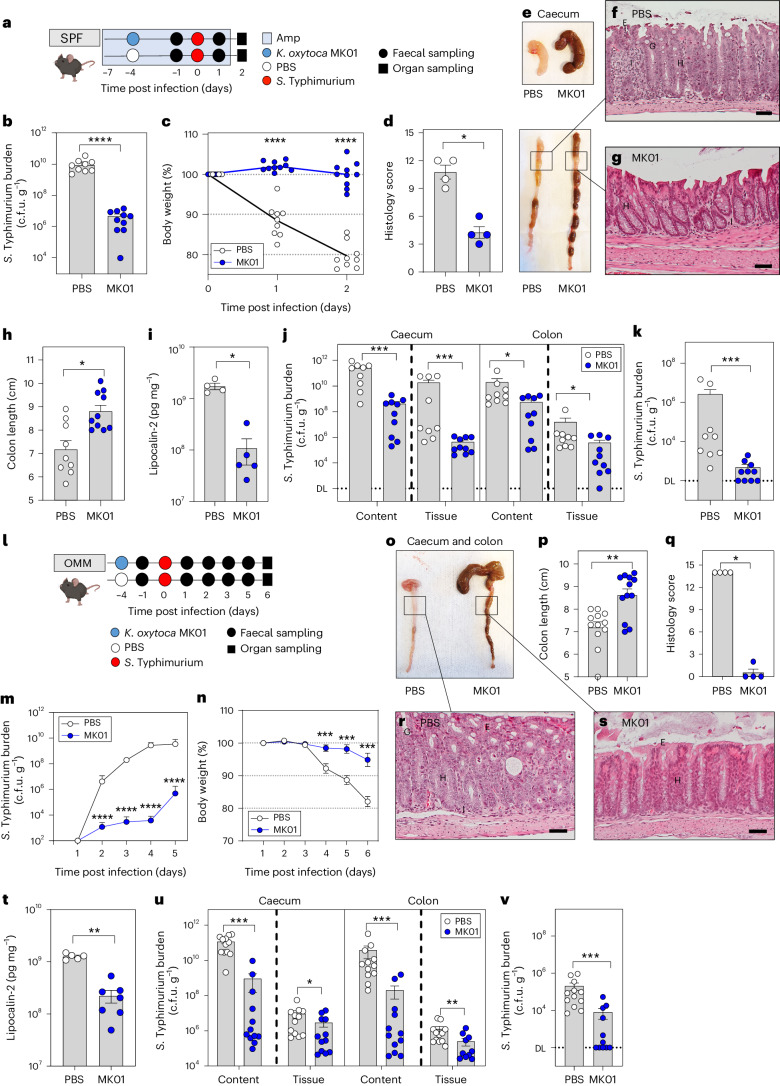
Fig. 1. K. oxytoca provides CR in different microbiota settings.
a, Ampicillin-treated SPF mice were colonized with K. oxytoca MK01 or left untreated 4 days before infection. On day 0, mice were orally infected with S. Typhimurium. BWL and faecal colonization were monitored until day 2 p.i. when organs were sampled for examination of S. Typhimurium burden. Amp, ampicillin. b,c, S. Typhimurium burden in the faeces on day 1 p.i. (b) and resulting BWL (c). d, Histological inflammation score of the proximal colon. e, Organ morphology of caecum and colon. f,g, Representative pictures of HE-stained sections of the proximal colon for both groups: PBS (f) and MK01 (g). E, erosion; G, goblet cells; H, hyperplasia; I, inflammatory cells. Scale bars, approximately 50 μm. h,i, Colon length (h) and lipocalin-2 levels (i) in the colon content on day 2 p.i. Mean ± s.e.m. of one experiment with n = 4 (PBS) or n = 5 (WT) mice. j, S. Typhimurium burden in the caecum and colon. DL, level of detection. k, S. Typhimurium burden in the liver. In b, c, h, j and k, mean ± s.e.m. of three pooled experiments with n = 9 (PBS) and 10 (MK01) mice. l, OMM12 mice were colonized with K. oxytoca MK01 or left untreated 4 days before infection. On day 0, mice were orally infected with S. Typhimurium, and BWL and faecal colonization were monitored until day 6 p.i. when organs were sampled for examination of S. Typhimurium burden. m,n, Faecal burden of S. Typhimurium (m) and resulting BWL over the time of infection (n). o–s, Visual examination of caecum and colon morphology (o) with resulting colon length (p) and histological inflammation score of the proximal colon (q), with representative HE-stained sections of both groups: PBS (r) and MK01 (s). Scale bars, 50 μm. t, Lipocalin-2 levels in the colon content on day 6 p.i., mean ± s.e.m. of two experiments with n = 5 (PBS) or n = 7 (WT) mice. u, S. Typhimurium burden in the caecum and colon. v, S. Typhimurium burden in the liver. In m, n and p–v, mean ± s.e.m. of n = 3 experiments with n = 12 mice per group. In d and q, mean ± s.e.m. of one experiment with n = 4 mice. In b–d, h–k, m, n, p, q and t–v, two-tailed Mann–Whitney U-test with *P < 0.05, **P < 0.01, ***P < 0.001 and ****P < 0.0001. See also Extended Data Figs. 1 and 2.

