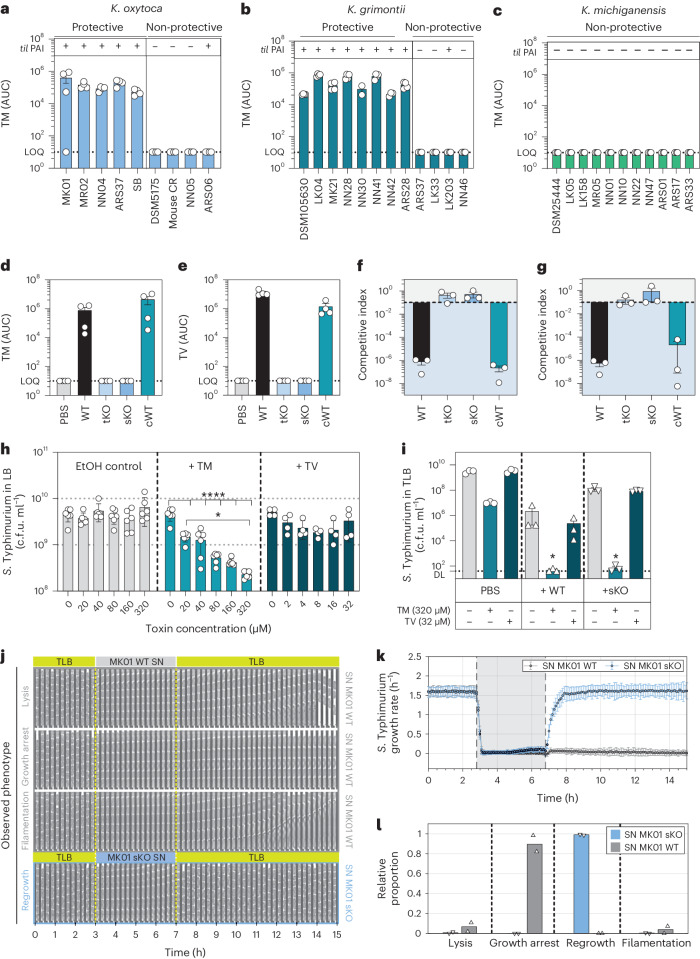
Fig. 3. K. oxytoca toxin production is crucial for protective capability in vitro.
SNs of various KoSC strains were assessed for TM (m/z = 235) and TV (m/z = 334) using HPLC. a–c, Resulting AUC for TM in sample SNs of K. oxytoca (a), K. grimontii (b) and K. michiganensis (c) strains. Mean ± s.e.m. of one experiment with n = 4 cultures. LOQ, limit of quantification. d,e, AUC for TM (d) and TV (e) of K. oxytoca MK01 WT, tKO, sKO and complemented mutant (cWT). Mean ± s.e.m. of one experiment with n = 4 cultures. f,g, CI of S. Typhimurium after 24 h of co-cultivation with K. oxytoca WT and mutants in GF caecal content media (f) and TLB (g). The dashed line indicates the starting ratio of bacteria (index = 0.1). Mean ± s.e.m. of n = 3 independent experiments with n = 2–3 technical replicates per group. h, colony-forming units of S. Typhimurium grown for 24 h in LB supplemented with various concentrations of TM/TV or EtOH as solvent control. Mean ± s.e.m. of two experiments with n = 4–6 independent cultures of S. Typhimurium. P values indicated represent one-way ANOVA with Tukey’s multiple comparisons test with *P < 0.05 and ****P < 0.0001. i, Resulting S. Typhimurium colony-forming units after co-cultivation with MK01 WT and sKO strain in the absence or presence of 320 µM TM or 32 µM TV. Mean ± s.e.m. of n = 3 experiments with n = 2 technical replicates. P values indicated represent one-way ANOVA with Dunn’s multiple comparisons test with *P < 0.05. j, Representative kymographs of S. Typhimurium mother lineages upon 4 h exposure to spent SN from MK01 WT or MK01 sKO displaying cell lysis, growth arrest or filamentation or regrowth. k, S. Typhimurium growth rates over time. Mean ± s.d. of 1 out of 3 mother machine experiments with n = 36,970 cell division cycles. l, The relative proportion of mother lineages corresponding to different phenotypes upon exposure to SN of MK01 WT or MK01 sKO. Mean from n = 2 independent experiments, corresponding to n = 552 mother cells. See also Extended Data Figs. 4 and 5.

