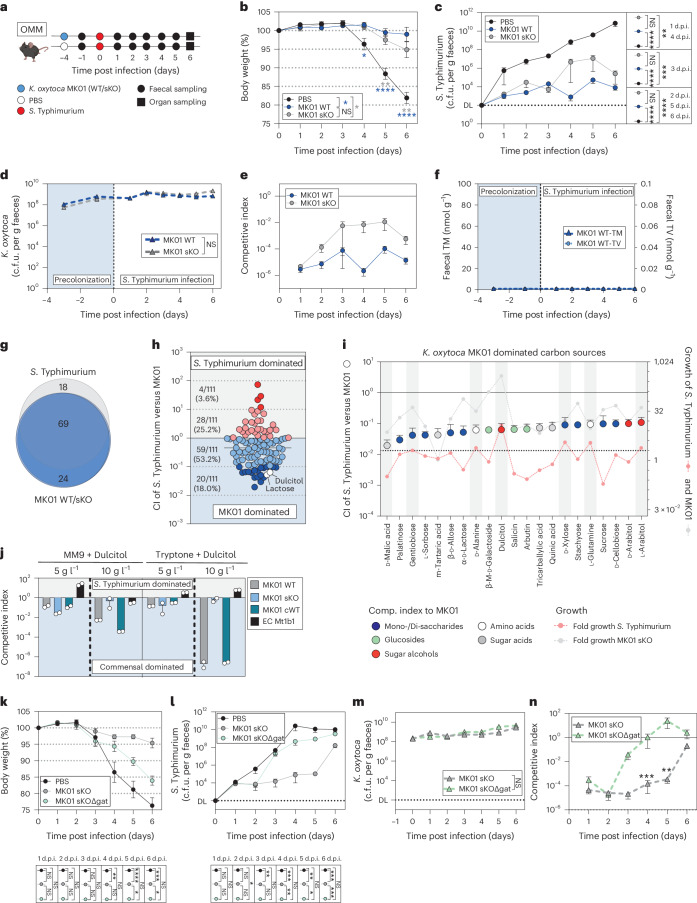
Fig. 6. Protective phenotype of K. oxytoca in homeostatic microbiota is dependent on carbohydrate competition.
a, OMM12 mice were colonized with K. oxytoca MK01 WT, sKO or left untreated 4 days before infection. On day 0, mice were orally infected with S. Typhimurium, and BWL, faecal colonization and microbiome composition were monitored until day 6 p.i. when organs were sampled. b–e, BWL (b), faecal colony-forming units of S. Typhimurium (c) and K. oxytoca (d) and CI of WT and sKO colonized mice (e). DL, level of detection; d.p.i., days post infection. f, Faecal TM and TV over time. (b–f) Mean ± s.e.m. of n = 3 experiments with n = 12 (PBS/sKO) or n = 13 (WT) mice per group. g, Venn diagram displaying carbon source overlap of S. Typhimurium and MK01 WT/sKO based on n = 4 independent measurements. h, CI of S. Typhimurium after co-cultivation with sKO in 111 carbon sources in a 1:1 ratio. i, The top 20 K. oxytoca-dominated carbon sources displayed as CI (left y-axis) in comparison to the growth of both bacteria in single cultures (right y-axis). The dashed line indicates active growth >2. In h and i, mean ± s.e.m. of n = 4 independent measurements. j, CI of S. Typhimurium co-cultures with MK01 WT, sKO, cWT, and E. coli Mt1b1 strains in MM9 or TB supplemented with dulcitol. Mean ± s.e.m. of n = 2 experiments with n = 2 technical replicates are displayed. k–n, OMM12 mice were colonized with K. oxytoca MK01 sKO, sKOΔgatABC or left untreated 4 days before infection. On day 0, mice were orally infected with S. Typhimurium, and BWL and faecal colonization was monitored until day 6 p.i. when organs were sampled. BWL (k); faecal colony-forming units of S. Typhimurium (l) and K. oxytoca (m); and resulting CI of K. oxytoca colonized mice (n). The mean and s.e.m. of n = 2 experiments with n = 7 (PBS) or n = 8 (sKO/ sKOΔgatABC) mice per group. In b, c, k and l, ordinary one-way ANOVA with Dunn’s multiple comparisons test between groups with *P < 0.05, **P < 0.01, ***P < 0.001 and ****P < 0.0001. In d–f, m and n, two-tailed Mann–Whitney U-test with *P < 0.05, **P < 0.01, ***P < 0.001 and ****P < 0.0001. In h, i, j and n, the solid line indicates the starting ratio of bacteria (index = 1). See also Extended Data Figs. 7–10.

