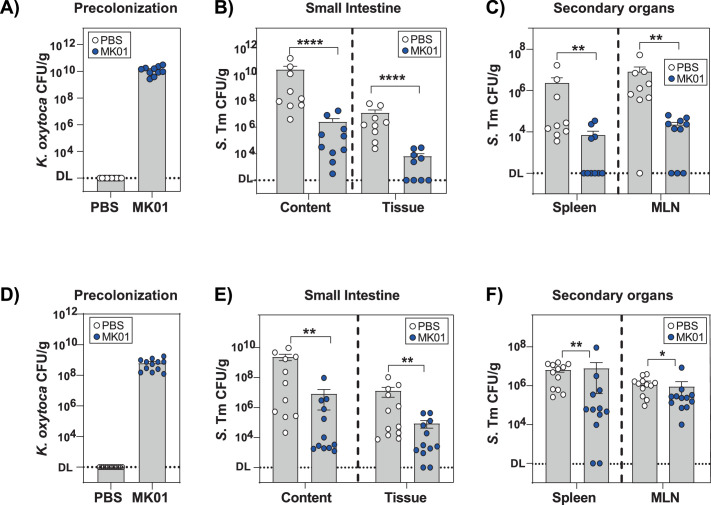
Extended Data Fig. 1. K. oxytoca provides colonization resistance in different microbiota settings.
(a) Fecal colonization levels of K. oxytoca MK01 precolonized SPF mice at day 0. (b) S. Tm burden in the lumen and tissue of small intestine and (c) various secondary organs including spleen and MLN of S. Tm-infected SPF mice at day 2 p.i. (a-c) Mean ± SEM of three independent experiments with n = 9 (PBS) or 10 (MK01) mice per group are displayed. P-values indicated represent two-tailed Mann-Whitney U-test with *p < 0.05, **p < 0.01, ***p < 0.001 and ****p < 0.0001. (d) Fecal colonization levels of K. oxytoca MK01 precolonized OMM12 mice at day 0. (e) S. Tm burden in the lumen and tissue of small intestine and (f) various secondary organs including spleen and MLN of S. Tm infected OMM12 mice at day 6 p.i. (d-f) Mean ± SEM of three independent experiments with n = 12 mice per group are displayed. P-values indicated represent two-tailed Mann-Whitney U-test with *p < 0.05, **p < 0.01, ***p < 0.001 and ****p < 0.0001.

