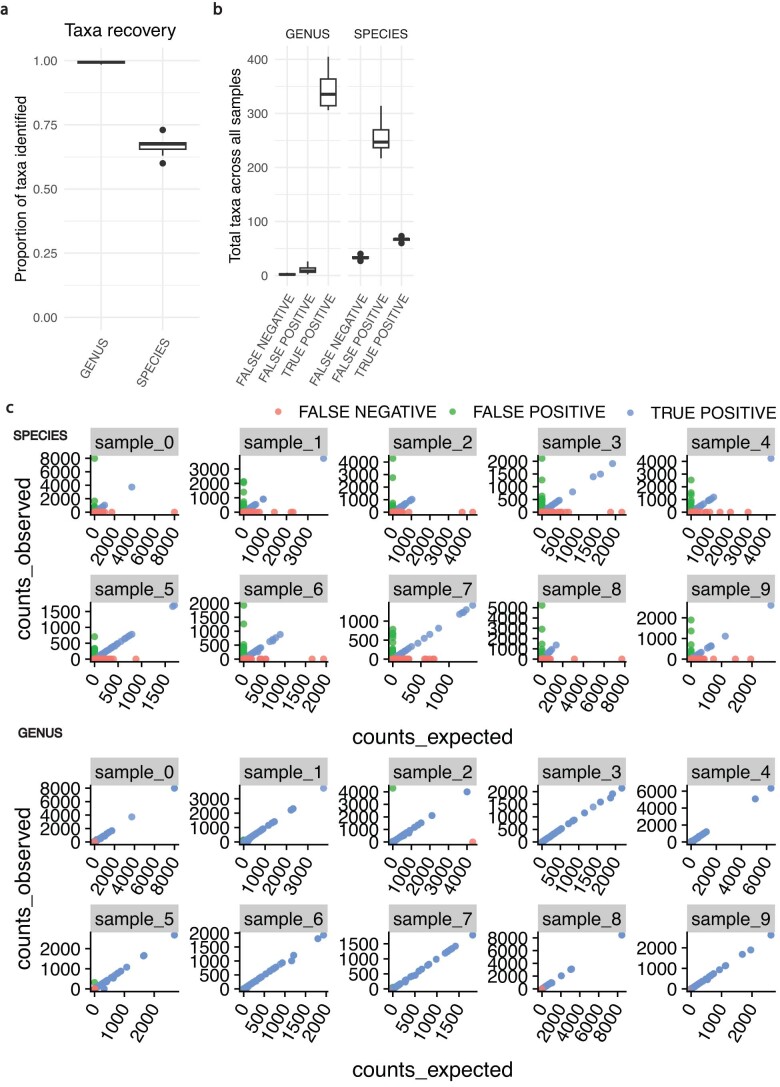
Extended Data Fig. 10. Viral classifier benchmarking.
Benchmarking a viral classifier across taxonomic ranks. Synthetic viral communities were generated from 100 genomes at random levels of abundance (from the GenBank database used in the rest of this study). a) The number of recovered genomes out of 100, for 10 mock communities for the genus and species levels. N = 10 independently generated mock communities. b) The number of true positive (identified and present in the sample), false positive (identified but not present in the sample), and false negative (that is, not recovered) genomes for the genus and species levels. N = 10 independently generated mock communities. c) The correlation between observed and expected read counts for each taxon as a function of being a true positive, false positive, or false negative. Lines on box plots in A and B indicate minimum and maximum values. The median is the centerline, and the bounds of the box are the interquartile range. The whiskers extend to 1.5 times the interquartile range of the upper and lower quartiles.

