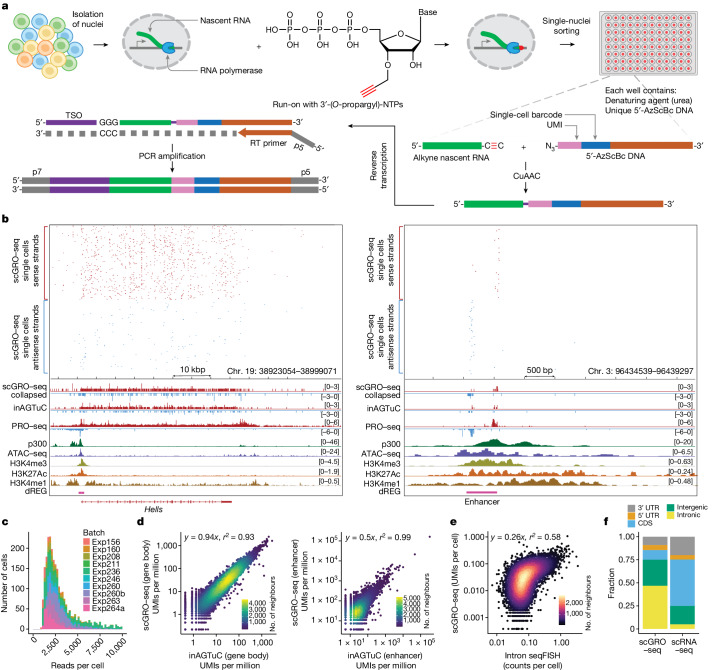
Fig. 1. Schematics and benchmarking of single-cell nascent RNA sequencing.
a, A summary of the scGRO–seq workflow. b, Representative genome browser screenshots showing scGRO–seq UMIs at a single-cell resolution, the aggregate scGRO–seq profile, the inAGTuC profile, the PRO–seq profile and chromatin marks around a gene (left) and an enhancer (right). c, Distribution of scGRO–seq UMIs per cell. d, Correlation between aggregate scGRO–seq and inAGTuC UMIs per million sequences in the body of genes (left, n = 19,961) and enhancers (right, n = 12,542). UMIs from the 500 bp regions from each end of the genes and 250 bp regions from each end of the enhancers analysed were removed to only include nascent RNA from elongating RNA polymerases. Data are plotted on a log–log scale to show the range of data distribution. e, Correlation between scGRO–seq UMIs per cell from up to the first 20 kb of genes and intron seqFISH counts per cell in the body of genes used in the intron seqFISH study (n = 9,666). f, Distribution of scGRO–seq and scRNA-seq UMIs in various genomic regions.

