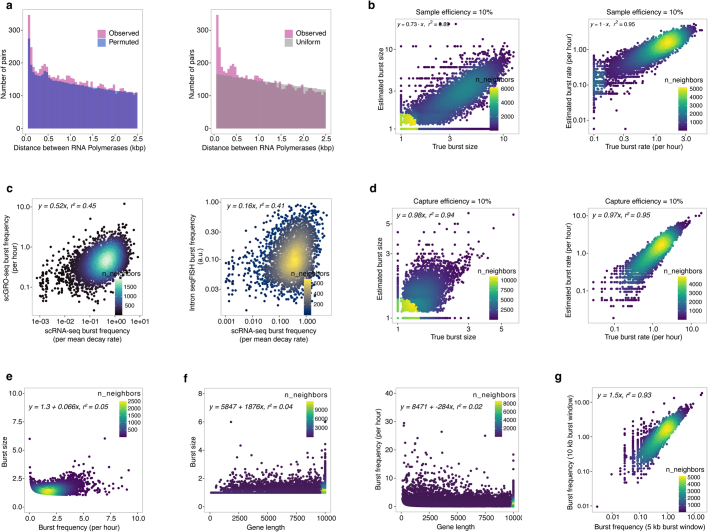
Extended Data Fig. 8. Effect of transcription level, gene length, and burst duration in transcription burst kinetics.
a, Distribution of distances between consecutive RNA polymerases in the first 10 kb of the gene body in single cells compared with distances from permuted data (randomized cell ID while maintaining UMIs per cell but unchanged read position, left) or uniform data (randomized read position along the gene but unchanged cell ID, right). Distances up to 2.5 kb are shown. b, Test of burst kinetics estimators by simulating burst size and burst frequency. c, Test of our burst kinetics estimators by simulating read counts using burst size and frequency inferred from observed scGRO-seq dataset. d, Correlation of burst frequency of genes higher than 0.1 in both datasets between scGRO-seq and intron seqFISH. e, Correlation between the burst frequency from scGO-seq (top) and intron seqFISH (bottom) with the burst frequency from scRNA-seq. f, The effect of gene length (from 100 bp to 10 kb after trimming 500 bp on either end of the genes) on burst size and frequency. g, Correlation between burst frequencies calculated from the burst window of either the first 5 kb or the first 10 kb gene bodies. In panels b-g with the log-log scale, the data was plotted on a log-log scale to show the range of data distribution. The y = mx fit was derived from linear data.

