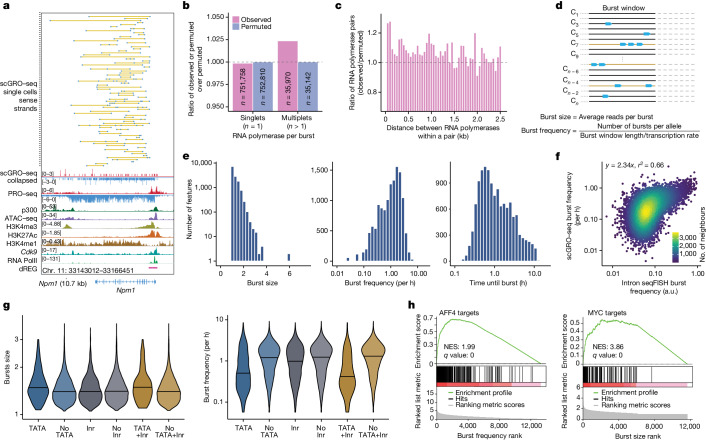
Fig. 2. Inference of transcription kinetics using scGRO–seq.
a, Single-cell view of multiplet RNA polymerase (blue dots) in Npm1. A yellow line connects RNA polymerases within the same cell. Randomly sampled 75 single cells containing more than one RNA polymerase are shown on the top, followed by the aggregate scGRO–seq, PRO–seq, chromatin marks and transcription-associated factors profiles. b, Ratio of observed or permuted burst sizes compared against the average burst sizes from 200 permutations. c, Ratio of the observed distance between consecutive RNA polymerases in the first 10 kb of gene bodies in individual cells against the permuted data. Distances up to 2.5 kb are shown in 50 bp bins. d, Illustration of the model used for direct inference of burst kinetics from scGRO–seq data. e, Histogram of burst size (left), burst frequency (middle) and duration until the next burst (1/burst frequency) (right) for genes that are at least 10 kb long (n = 13,142). f, Correlation of burst frequency of genes between scGRO–seq and intron seqFISH data. g, Effect of promoter elements in burst size greater than 1 (left) and burst frequency (right). Inr, the initiator motif. The centre line indicates the median of the distribution. h, Gene set enrichment analyses showing the role of transcription factors in determining burst frequency and burst size.

