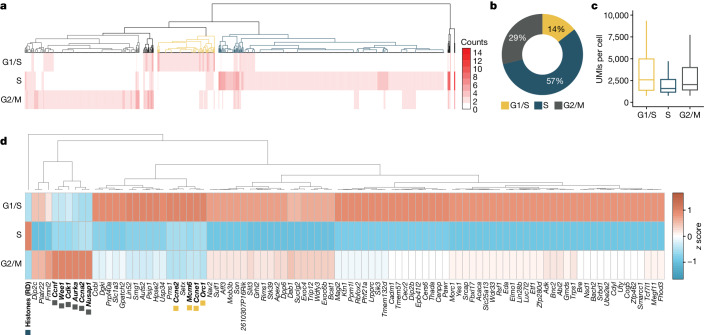
Fig. 3. Cell cycle inference by non-polyadenylated replication-dependent histone gene expression.
a, Heatmap of hierarchical clustering of single cells representing transcription of G1/S-specific, S-specific and G2/M-specific genes. The dendrogram colours represent cell clusters with cell-cycle-phase-specific gene transcription. b, Fraction of cells in the three primary clusters distinguished by transcription of G1/S-specific, S-specific and G2/M-specific genes. c, Distribution of scGRO–seq UMIs per cell in the three clusters of cells (n = 122, 479 and 244 cells, respectively, from 10 independent batches) defined by cell-cycle-phase-specific gene transcription. The centre line indicates the median, the box represents the data between the first and third quantiles, the whiskers indicate the 1.5 interquartile range, and points outside the whiskers indicate outliers. d, Differentially expressed genes among the three clusters of cells defined by transcription of G1/S-specific, S-specific and G2/M-specific genes. The genes used to classify cells are denoted in bold and coloured boxes. Histones (RD) represent aggregate reads from replication-dependent histone genes.

