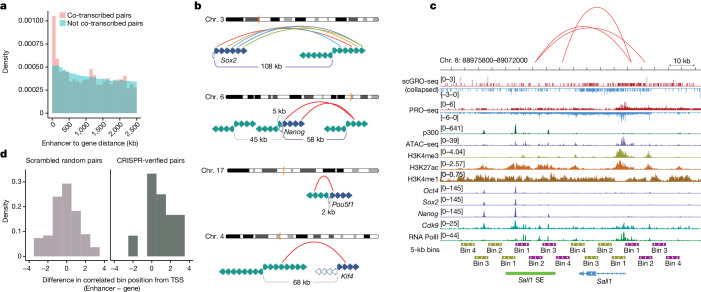
Fig. 5. Spatial and temporal coordination between genes and enhancers.
a, Distance between correlated and non-correlated enhancer–gene pairs within 2.5 Mb of each other. b, Co-transcription between pluripotency genes (filled blue arrows indicate sense gene bins, open blue arrows indicate antisense gene bins) and their enhancers (represented by green arrows, and the arrow directions indicate sense and antisense directions). Correlated full-length enhancer–gene pairs (Sox2 and Nanog) are shown with purple distance bars. For finer time resolution correlation, features are extended up to the end of the transcription signal and divided into 5 kb bins. Correlated bins are represented by a red arch, except for Sox2 and its distal enhancer bins, which are shown in different colours for visual aid. c, Co-transcription between Sall1 and its CRISPR-verified SE. Correlated SE–gene bins are denoted by arches. d, Summary of correlated bin positions in CRISPR-verified SE–gene pairs. Scrambled random pairs served as a control.

