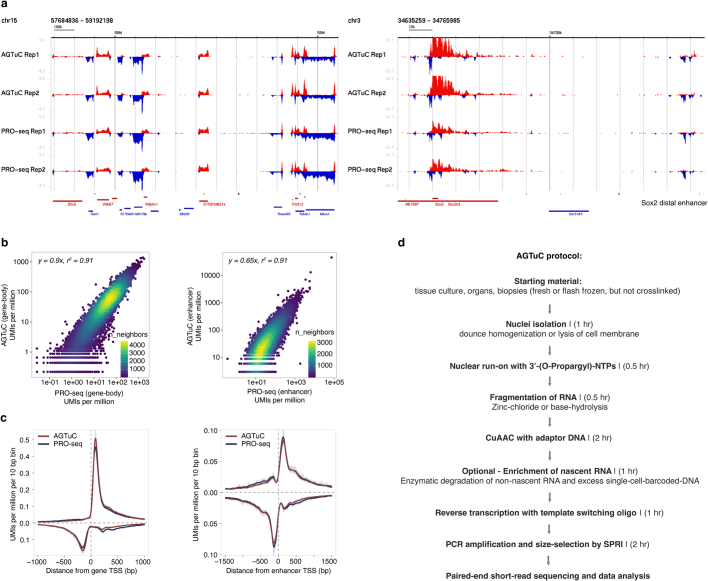
Extended Data Fig. 2. Comparison between AGTuC and PRO-seq.
a, Representative genome-browser screenshots with two replicates of AGTuC and PRO-seq showing a region in chromosome 15 (left) and a region in chromosome 3 containing the Sox2 gene and its distal enhancer (right) of the mouse genome (mm10). b, Correlation between AGTuC and PRO-seq UMIs per million sequences in gene bodies (left, n = 19,961) and enhancers (right, n = 12,542). UMIs from the 500 bp regions from each end of the genes and 250 bp regions from each end of the enhancers were removed to only include nascent RNA from elongating RNA polymerases, and the data was plotted on a log-log scale to show the range of data distribution. c, Metagene profiles of AGTuC and PRO-seq UMIs per million per 10 base pair bins around the TSS of genes (left, n = 19,961) and enhancers (right, n = 12,542). The line represents the mean, and the shaded region represents a 95% confidence interval. d, Major steps with the approximate time required in AGTuC library preparation.

