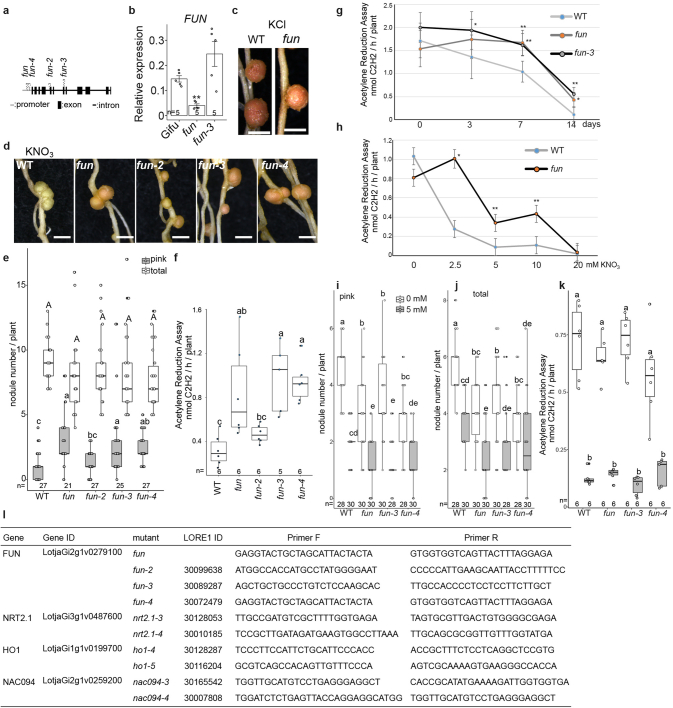
Extended Data Fig. 2. Nitrate suppression of nitrogen fixation of fun alleles.
a The diagram of FUN gene and LORE1 insertions of each allele. There are 12 exons. In fun and fun-4 (30072479), LORE1 is inserted in the promoter regions. In fun-2 (30099638), LORE1 is inserted at the end of the fourth intron. In fun-3 (30089287), LORE1 is inserted at the end of the seventh exon. b The gene expression of FUN in fun and fun-3 mutants. RNA were extracted from WT, fun, and fun-3 nodules. c-f, The nitrogen fixation of fun mutants after high concentrations of nitrate treatments. 3 week post inoculation WT and fun mutants (with mature nodules) were watered with 10 mM KNO3 for another two weeks. The nodule under KCl (c), under KNO3 (d), nodule number (e), and ARA activity (f) were counted or measured after 2 weeks of nitrate exposure. g-h, Time and dose series of nitrate treatments. The ARA activity of fun mutants (with mature nodules) exposed to 10 mM KNO3 for 0, 3, 7, and 14 days (g). ARA activity (d) of fun mutants (with mature nodules) under 2-week 0, 2.5, 5, 10 and 20 mM KNO3 exposure (h). i-k, Phenotypes of fun mutants with nitrate application prior to inoculation. Plants were grown on plates with 0 or 5 mM KNO3 and inoculated with rhizobia, pink (i) and total (j) nodule number, and ARA (k) of wild type and fun mutants were measured 3 weeks post inoculation. l The LORE1 IDs, primers, and their sequences of individual mutants used in the manuscript. Scale bars in c and d are 1 cm. Bars show mean ± SE and individual values (dots) in b. Box plots show Min, Q1, Median, Q3, Max and individual values (dots) in e-f and i-k. Significant differences among different genotypes are indicated by letters (p < 0.05) as determined by ANOVA and Tukey post-hoc testing with pairwise P-values indicated (**: p value < 0.01; *: p value < 0.05). Images and data for WT and fun are reproduced from Fig. 1b, c and d alongside the additional alleles shown here. Biological independent samples n value shown on each box plots and bar plots.

