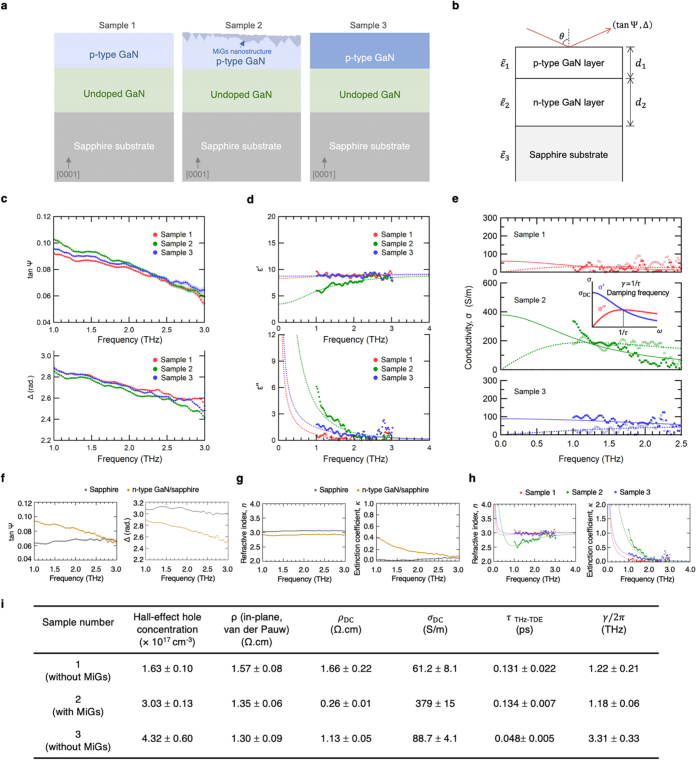
Extended Data Fig. 6. Terahertz time-domain ellipsometry (THz-TDE) on the MiGs-incorporated p-type GaN.
a, Schematic illustrations of three samples, each with a 400 nm-thick p-type GaN epilayer, are shown. These form two control groups: one varying in-situ Mg doping concentration (Sample 1 vs. 3) and the other comparing samples with and without MiGs nanostructures (Sample 1 vs. 2). b, Schematic illustration of the samples featuring a three-layer structure: p-type GaN/n-type GaN/sapphire, irradiated by incoming terahertz electromagnetic waves. Each layer is denoted as 1, 2, and 3, respectively. The thickness parameters, d1 and d2, are 400 nm and 3.9 µm, respectively. The optical constants, and , were obtained from separate measurements, elaborated in the Methods section. The optical model approximates the p-type GaN layer with MiGs nanostructure on top as a single layer, with the acquired optical constants for of Sample 2 assumed to be an average response of layer 1. c, Ellipsometric parameters (tan Ψ, Δ) measured by THz-TDE. The shading corresponds to the uncertainty in the measured values. The uncertainty region is not visible as it is significantly smaller than the measured values, with a standard deviation of less than 0.003 for the ellipsometric parameters. d, Real (ε′) and imaginary (ε″) parts of the relative permittivity obtained for the p-GaN layers, denoted as , are complex relative permittivity of the top, represented as . The increase in ε″ at lower frequencies is attributed to THz absorption by free carriers. A higher ε″ indicates greater absorption and, consequently, higher conductivity. e, Real (solid circles) σ′ and imaginary (hollow circles) σ″ parts of the conductivity , derived from the relative permittivity spectra of the p-GaN layers, are represented as . The fitting range is set within 1.0−2.5 THz to exclude noise at higher frequencies, which is not shown. The best fit results from a global analysis of the real and imaginary components. By fitting the conductivity spectra to the Drude model, the DC conductivity σDC (translated to static resistivity ρDC), the scattering time τ, and the damping frequency γ can be estimated by , as summarized in i. f, Ellipsometric parameters (tan Ψ, Δ) measured from the sapphire substrate and the n-type GaN/sapphire sample. g, Complex refractive index obtained for sapphire and the n-type GaN layer. h, Complex refractive index spectra obtained for the p-type GaN layers and fitted to the Drude model. i, Summary and comparison of the measured transport properties by THz-TDE and Hall-effect van der Pauw methods.

