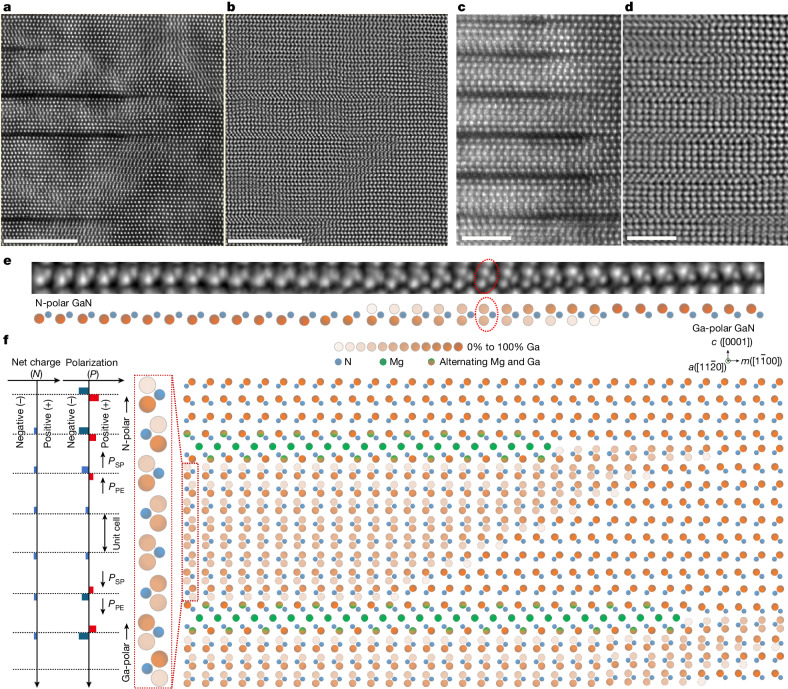
Fig. 2. Polarity transition induced by 2D-Mgi intercalant sheets.
a,b, HAADF-STEM (a) and iDPC-STEM (b) images of the same region showing the edge of vertically aligned 2D-Mgi sheets along the [] zone axis (a axis). c,d, Magnified HAADF-STEM (c) and iDPC-STEM (d) images of the same region along the [] zone axis (a axis). e, Top, an iDPC-STEM image that atomically resolves a monolayer of GaN, demonstrating a gradual transition in polarity over a few atoms. N atoms remain in their original positions but Ga atoms transition from lower sites (N-polar) to upper sites (Ga-polar) relative to N atoms. The red ellipse highlights a line of GaN (along the a axis and perpendicular to the page) in the region of the polarity transition. Bottom, a schematic illustrating the transition shown in the iDPC-STEM image. f, A schematic of the area at the edge of a pair of 2D-Mgi sheets, emphasizing the polarity transitions from N-polar to Ga-polar GaN occurring both perpendicular and parallel to the Mg sheets. The gradient of Ga occupancy at specific sites is represented by varying shades of orange (from 0% to 100%), indicating the average occupancy of Ga. The multicoloured symbols represent alternating occupancy by Mg and Ga along the a axis. Left, the net charges resulting from the polarity transition are shown, including changes in the polarization field (spontaneous polarization (PSP) and piezoelectric polarization (PPE)) along the c axis. This leads to unbalanced polarization-induced charges, N, resulting from the gradient of the polarization field, P, where N = 1/q|∇ ⋅ P| and q is the elementary charge (ref. 14). Scale bars, 10 nm (a–d).

