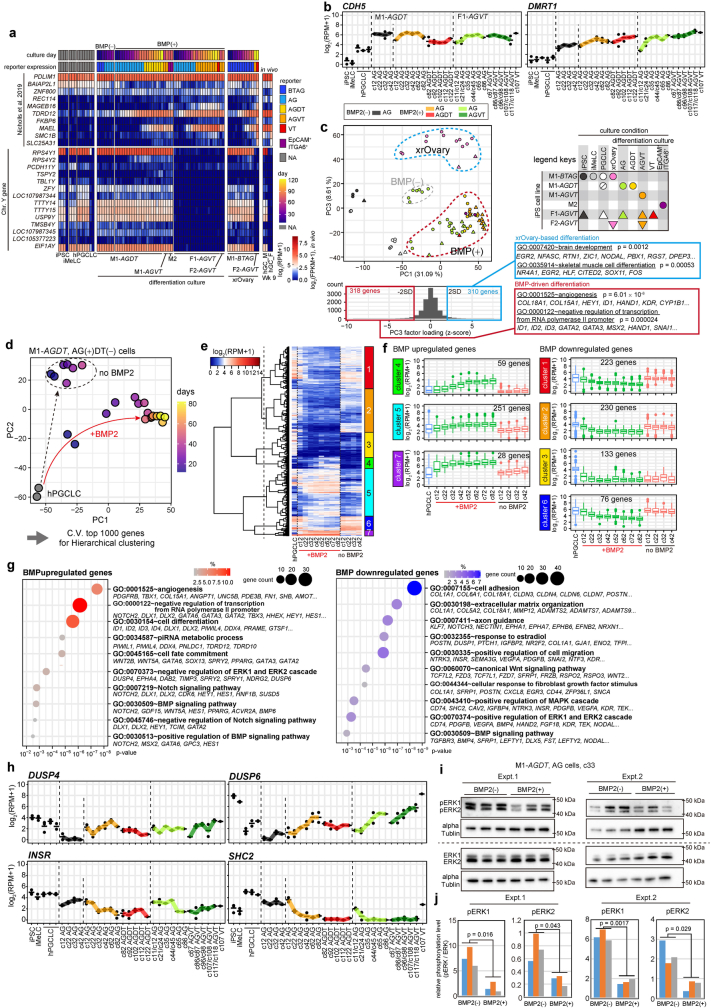
Extended Data Fig. 5. Identification of distinctive transcriptional processes driven by BMP signaling.
a, Heatmap showing the expression levels of 13 previously reported genes that show up-regulation in gonadal germ cells (DAZL and DDX4 are excluded)19 (top), and the unique genes on the Y chromosome (bottom) in the indicated cell types (see Supplementary Table 2 for full sample information). Color coding is as indicated. NA: not applicable. b, Expression dynamics of CDH5 and DMRT1, the genes used as markers for human germ cells from the migration stage onward20, during hPGCLC induction and BMP-driven hPGCLC differentiation. The average (bar) and replicate (circles) values are shown (see Supplementary Table 2 for full sample information). The data for iPSCs, iMeLCs were with M1-BTAG, and the data for hPGCLCs were with the M1-BTAG, M1-AGDT, and F1-AGVT lines. Color coding is as indicated. c, PC1−PC3 plane of the PCA of transcriptomes during hPGCLC induction and BMP-driven and xrOvary-based hPGCLC differentiation in Fig. 3b (left, top), and the GO enrichments with p values of genes contributing to the negative [standard deviation (SD) < − 2: BMP-up-regulated genes] and positive [SD > 2: xrOvary-up-regulated genes] scores of PC3 (left, bottom; right). Color coding is as indicated. d, PCA of M1-AGDT hPGCLC-derived AD+DT− cells cultured with or without BMP2. The color coding is as indicated. Genes expressed in at least one sample [log2(RPM + 1) ≥ 4] were used for PCA. e, UHC of highly variable genes (top 1,000 genes with high coefficient of variance) in (d) based on their expression dynamics. f, Box plots of the expression dynamics of the 7 gene clusters in (e) during hPGCLC culture with or without BMP2. The 7 gene clusters are classified into those showing progressive up- (clusters 4, 5, 7) or down- (clusters 1, 2, 3, 6) regulation during BMP-driven hPGCLC differentiation. Numbers of genes in each cluster are: n = 223 for cluster 1; n = 230 for cluster 2; n = 133 for cluster 3; n = 59 for cluster 4; n = 251 for cluster 5; n = 76 for cluster 6; n = 28 for cluster 7. The upper hinges, lower hinges, and middle lines indicate 75 percentiles, 25 percentiles, and median values, respectively. The whiskers are drawn in length equal to the inter-quartile range (IQR) multiplied by 1.5. Data beyond the upper/lower whiskers are shown as dots. g, Gene ontology (GO) enrichments and representative genes in up- (clusters 4, 5, 7) (left) and down- (clusters 1, 2, 3, 6) (right) regulated genes. p-values are provided by Fisher’s exact test. The color coding is as indicated. h, Expression dynamics of DUSP4 and DUSP6 (GO:0070373~negative regulation of ERK1 and ERK2 cascade), and INSR and SHC2 (GO:0043410~positive regulation of MAPK cascade) during hPGCLC induction and BMP-driven hPGCLC differentiation. The average (bar) and replicate (circles) values are shown (see Supplementary Table 2 for full sample information). The data for iPSCs, iMeLCs were with M1-BTAG, and the data for hPGCLCs were with the M1-BTAG, M1-AGDT, and F1-AGVT lines. i, Western blot analysis of the levels of phosphorylated or total ERK1 and 2 in M1-AGDT hPGCLC-derived cells at c33 cultured with or without BMP2. 3 independent cultures were analyzed for 2 biological replicates. αTUBLIN were used for the loading control. For the gel source data, see Supplementary Figure 3. pERK: phosphorylated ERK. j, Quantification of pERK1 and 2 levels normalized by αTUBLIN in M1-AGDT hPGCLC-derived cells at c33 cultured with or without BMP2 in (h). The average fold-differences of the Western blot signals for pERK1 and pERK2 were ~4.5-fold and ~2.9-fold (Expt. 1) and ~4.3-fold and ~3.9-fold (Expt. 2), respectively. p values with two-sided Welch’s t-test are shown. Data from 2 independent experiments with 3 biological replicates were shown in (i) and (j).

