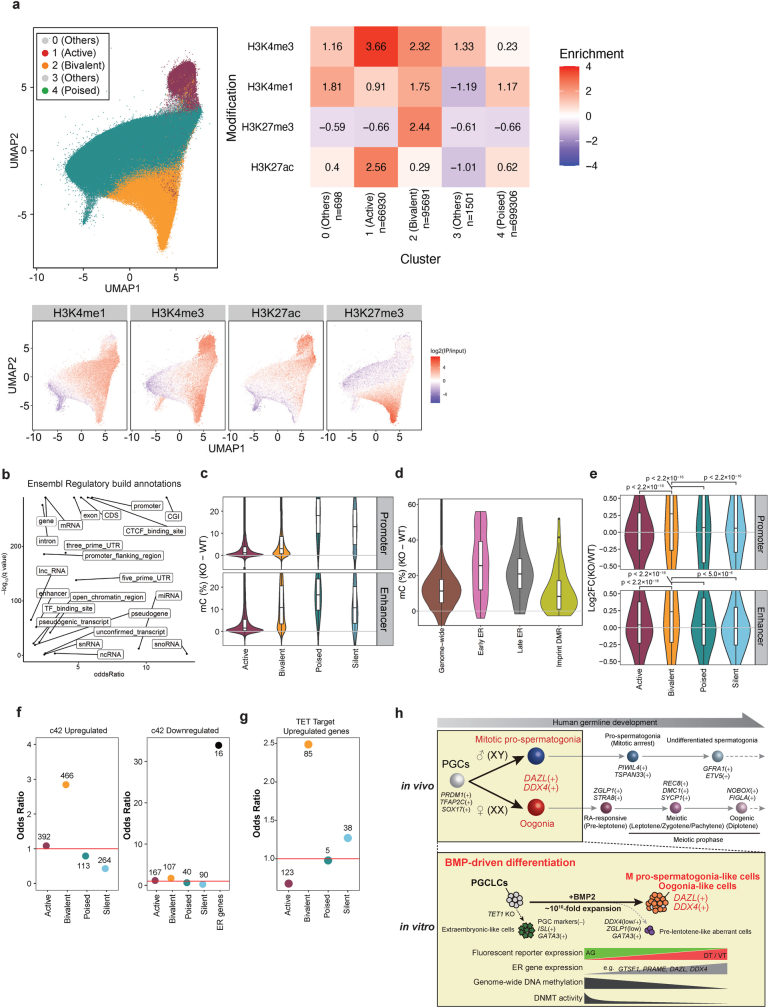
Extended Data Fig. 12. TET1 KO cells hyper-methylate regulatory elements and de-repress bivalent genes.
a, Two dimensional UMAP embedding of all open sites (ATAC-seq peaks) during hPGCLC induction based on epigenetic signals of relevant cell types using public data36, with labels derived from semi-supervised HDBSCAN (hierarchical density-based spatial clustering of applications with noise). The open sites were colored according to the labels (top, left) or signal intensities of relevant histone modifications (bottom). The averaged signal intensities of relevant histone modifications in each label (cluster) are shown (top, left). b, Odds ratio and q-value of the enrichment of the 2-kb bins with higher 5mC levels in TET1 KO cells compared to wild-type cells at c42 in the Ensembl Regulatory Build annotations. c−e, Violin plots for the 5mC-level (%) (c, d) and the expression-level (log2 fold-change) (e) differences between wild-type and TET1 KO hPGCLC-derived cells at c42 on the indicated elements. Annotations and the numbers of each element are same as Fig. 5d,e,g. In (e), p-values of each comparison are as follows: <2.2 × 10⁻¹⁶ for active promoter, poised promoter, silent promoter, active enhancer, and poised enhancer, p = 5.0 × 10⁻⁶ for silent enhancer (two-sided t-test adjusted by Bonferroni correction). Promoters, enhancers (non-promoter open sites), and their labels are based on the data for d4 hPGCLCs36. Silent promoters: promoters that did not overlap with open sites; silent enhancers: enhancers categorized neither into active, bivalent, nor poised. In (c−e), the upper hinges, lower hinges, and middle lines indicate 75 percentiles, 25 percentiles, and median values, respectively. The whiskers are drawn in length equal to the inter-quartile range (IQR) multiplied by 1.5. Data beyond the upper/lower whiskers are shown as dots. f, Odds ratio of the enrichment of genes with indicated promoters defined in d4 hPGCLCs36 and ER genes (for down-regulated genes) in genes up- (left) or down- (right) regulated in TET1 KO hPGCLC-derived cells at c42. Number of each gene class is indicated. g, Odds ratio of the c42 up-regulated genes bound by TET in hESCs39 in each category of promoters. The odds ratio was calculated relative to the background ratio of all genes bound by TET in each respective promoter category. Number of each gene class is indicated. h, A summery scheme of the present work.

