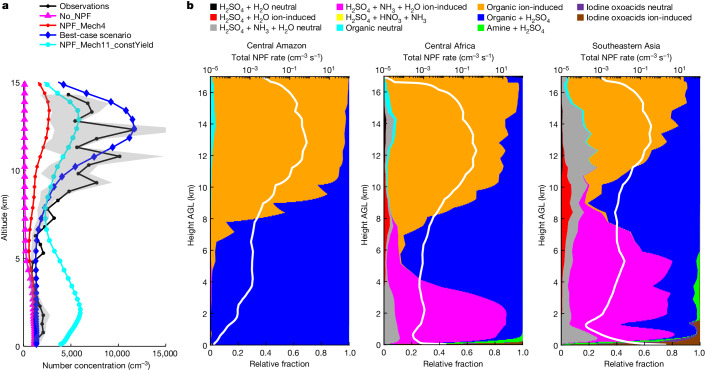
Fig. 1. Mechanisms of NPF and constraints from observations over rainforests.
a, Comparison of simulated particle number concentrations with aircraft measurements obtained over the Amazon during the ACRIDICON-CHUVA campaign in September 2014. Both simulations and observations are for particles >10 nm near the surface and 20 nm above the altitude of 13.8 km, with smooth transition between. The lines represent mean concentrations within each vertical bin and the shaded areas represent the 25th to 75th percentiles of the observations. All particle number concentrations are normalized to standard temperature and pressure (273.15 K and 101.325 kPa). Definitions of the model scenarios are given in the main text and Supplementary Table 1. b, NPF rates as a function of height AGL over the Central Amazon, Central Africa and Southeastern Asia. White lines represent the total NPF rates of all mechanisms at a diameter of 1.7 nm (J1.7, on a log scale) and the coloured areas represent the relative contributions of different mechanisms, both averaged in 2016 over the regions specified in Extended Data Fig. 1b.

