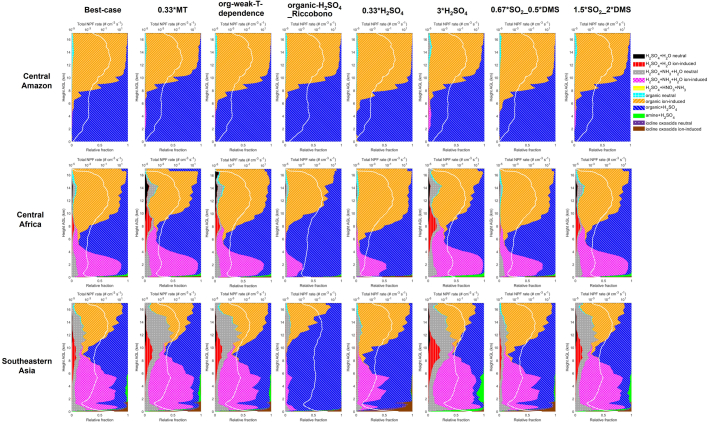
Extended Data Fig. 5. NPF rates as a function of height AGL over rainforests under the best-case and sensitivity scenarios.
White lines represent the total NPF rates of all mechanisms at a diameter of 1.7 nm (J1.7, on a log scale) and the coloured areas represent the relative contributions of different mechanisms, both averaged in 2016 over the regions specified in Extended Data Fig. 1b. Definitions of the sensitivity experiments are presented in Methods and Supplementary Table 1.

