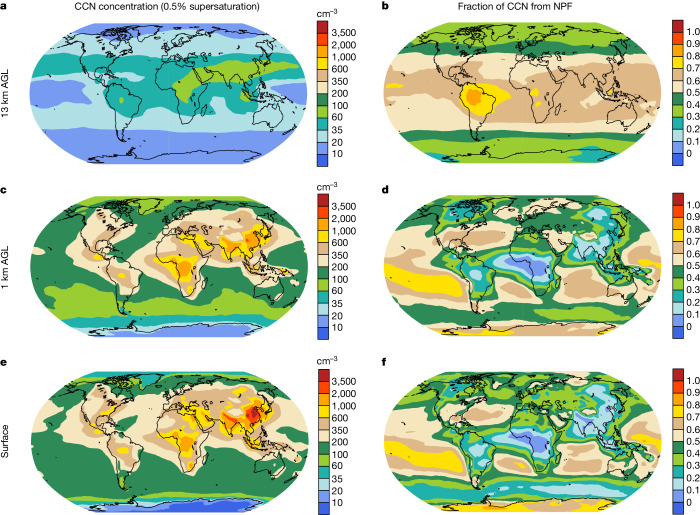
Fig. 5. CCN concentrations and fractions of CCN caused by NPF at different vertical levels in 2016.
a,c,e, Spatial distribution of CCN concentrations at 0.5% supersaturation (CCN0.5%) at 13 km AGL (a), 1 km AGL (approximately at the low-cloud level) (c) and surface level (e). b,d,e, Fractions of CCN0.5% caused by NPF at 13 km AGL (b), 1 km AGL (d) and surface level (f). All concentrations are normalized to standard temperature and pressure. Maps were created using the NCAR Command Language (version 6.6.2), 10.5065/D6WD3XH5.

