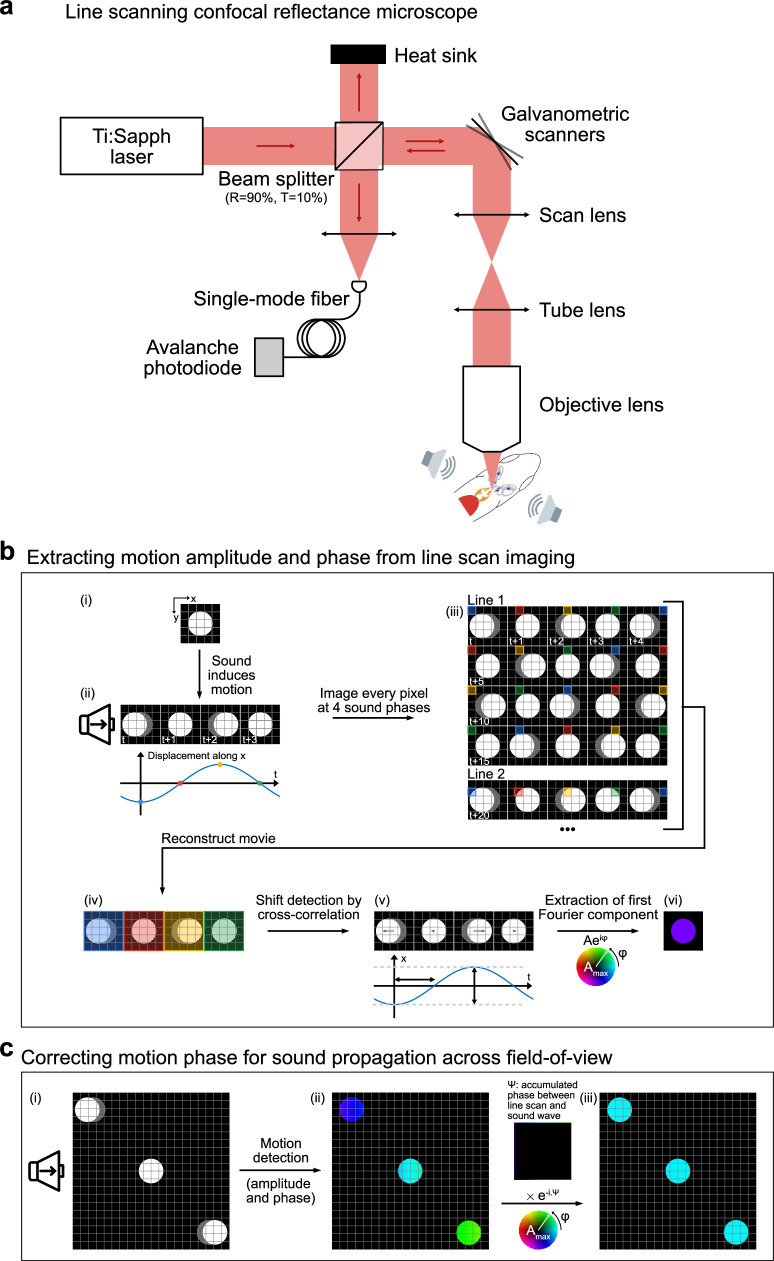
Extended Data Fig. 10. Method for extracting 2D phase maps of tissue motion with laser scanning confocal reflectance microscopy.
a, Experimental setup (see Methods section on vibrometry for details on the acoustic stimulation system). b, Illustration of phase map extraction: (i) A single bead is located within the field-of-view and (ii) oscillates in the horizontal x direction during acoustic stimulation. (iii) The bead is imaged with a laser scanning microscope, with each pixel being acquired at a different time. Line-scan and acoustic stimulation are synchronized to probe the bead at four different phases (blue: 0, red: π/2, yellow: π, green: 3π/2). (iv) Data are reshaped to reconstruct the full movie of the bead motion. (v) The bead displacement is computed using a cross-correlation-based algorithm (see Methods). (vi) The amplitude and phase of the first Fourier component of the bead displacement are extracted and plotted respectively with hue and color. c, (i) The sound phase and consequently the bead displacement phase is drifting when the pressure wave propagates along the horizontal x direction. Different motion phases are then detected for objects at different locations in the field-of-view, although being stimulated by the same sound wave. (ii) This additional phase Ψ is subtracted to yield a phase map with free objects exhibiting the same phase for the same sound stimulation. The final phase relationship between various objects therefore only depends on the mechanical properties of the imaged structure.

