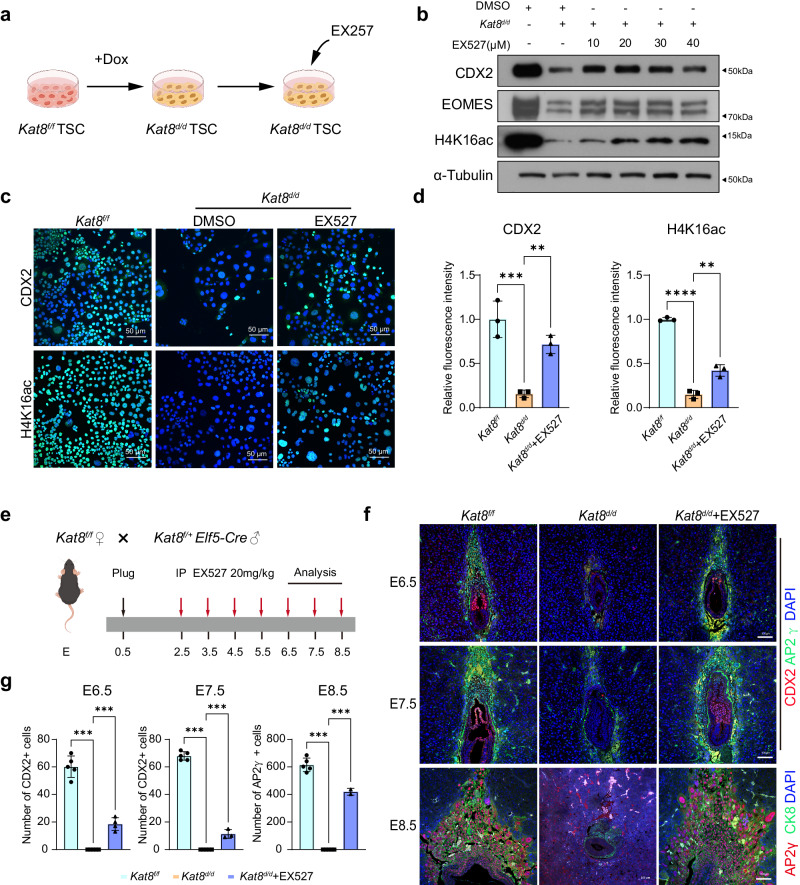
Fig. 5. EX527 partially rescue abnormal placental development caused by KAT8 knockout both in vitro and in vivo.
a Schematic representation illustrating the process of adding EX527 in Kat8d/d mTSCs. The graphic elements were created by figdraw. b Immunoblot analysis of CDX2, EOMES and H4K16ac in Kat8d/d mTSCs with or without EX527. c Immunofluorescent staining of CDX2 and H4K16ac in Kat8d/d mTSCs with or without EX527. d The quantitative results of C. Data are representative of three independent experiments (n = 3) and values are normalized to Kat8f/f control group and expressed in mean ± SEM. **P < 0.01, ***P < 0.001. Source data are provided as a Source Data file. e Schematic representation depicting the application of EX527 treatment on Kat8d/d embryos. The graphic elements were created by figdraw. f Immunofluorescent staining of CDX2, AP2γ and CK8 in Kat8f/f, Kat8d/d and EX527 treated Kat8d/d embryos. g Quantification of CDX2+ cells or AP2γ+ cells in implantation sites of the indicated genotypes. Each dot in the column represents one implantation site (E6.5, n = 6 for Kat8f/f, n = 6 for Kat8d/d, n = 6 for Kat8f/f + EX527; E7.5, n = 6 for Kat8f/f, n = 6 for Kat8d/d, n = 6 for Kat8f/f + EX527; E8.5, n = 6 for Kat8f/f, n = 6 for Kat8d/d, n = 2 for Kat8f/f + EX527). Two-tailed unpaired Student’s t-test. Error bars, mean ± SEM. *P < 0.05, **P < 0.01, ***P < 0.001. (n = 3 mice for Kat8f/f, n = 3 mice for Kat8d/d, n = 3 mice for Kat8f/f + EX527). Source data are provided as a Source Data file.

