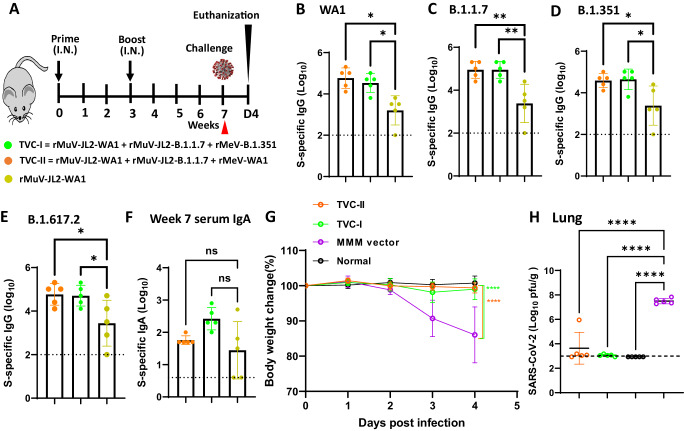
Fig. 1. Immunogenicity of trivalent vaccine candidates (TVC-I and TVC-II) in IFNAR1−/− mice.
A Schematic diagram of mice immunization, sample collection, and challenge. IFNAR1−/− mice (n = 5 per group) were immunized intranasally with 1.2 × 10⁶ PFU of TVC-I (a mixture of rMuV-JL2-WA1, rMuV JL2-B.1.1.7, and rMeV-B.1.351, 4 × 10⁵ PFU per virus), TVC-II (a mixture of rMuV-JL2-WA1, rMuV-JL2-B.1.1.7, and rMeV-WA1, 4 × 10⁵ PFU per virus), rMuV-JL2-WA1, or MMM vector control, and were boosted 3 weeks later. At week 7, sera were collected for detection of S-specific IgG titer using the preS-6P protein of SARS-CoV-2 WA1 (B), B.1.1.7 (C), B.1.351 (D), or B.1.617.2 (E) as ELISA coating antigen. (F) Serum IgA titer at week 7. The ELISA was conducted using the preS-6P protein of SARS-CoV-2 WA1 as the coating antigen. IgG and IgA titers are the geometric mean titer (GMT) of 5 mice ± standard deviation (SD). The P-value of TVC-I and TVC-II vs rMuV-JL2-WA1 in (B) is *P = 0.0327 and *P = 0.0116, C is *P = 0.0017 and *P = 0.0017, D is *P = 0.0219 and *P = 0.0292, and E is *P = 0.0472 and *P = 0.0361. G Changes in body weight of mice. At week 7, mice were challenged with SARS-CoV-2 MA10, and body weight was measured daily until day 4. Normal refers to animals inoculated with DMEM. Percent of initial body weight is shown. Data are the average of 5 mice (n = 5) ± SD. The P-value of TVC-I and TVC-II vs MMM vector is ****P = 2.893 × 10⁻⁷ and ****P = 2.03 × 10⁻⁸, respectively. H Viral burden in the lung. At day 4 post-challenge, SARS-CoV-2 MA10 titer in the lungs was measured by plaque assay. Data shown are the GMT of 5 mice (n = 5) ± SD. The P-value of TVC-I, TVC-II, and normal control vs MMM vector is ****P = 6.36 × 10⁻⁸, ****P = 4.414 × 10⁻⁷, and ****P = 4.35 × 10⁻⁸, respectively. The dotted line indicates the limit of detection (LoD) which is 2.7 Log10 PFU per gram of tissue. Statistical analyses in (B–F) and (H) were conducted using one-way ANOVA. Statistical analyses in (G) were conducted using two-way ANOVA. (*P <0.05; **P < 0.01; ***P < 0.001; ****P < 0.0001; ns, not significant). Source data are provided in the Source Data file.

