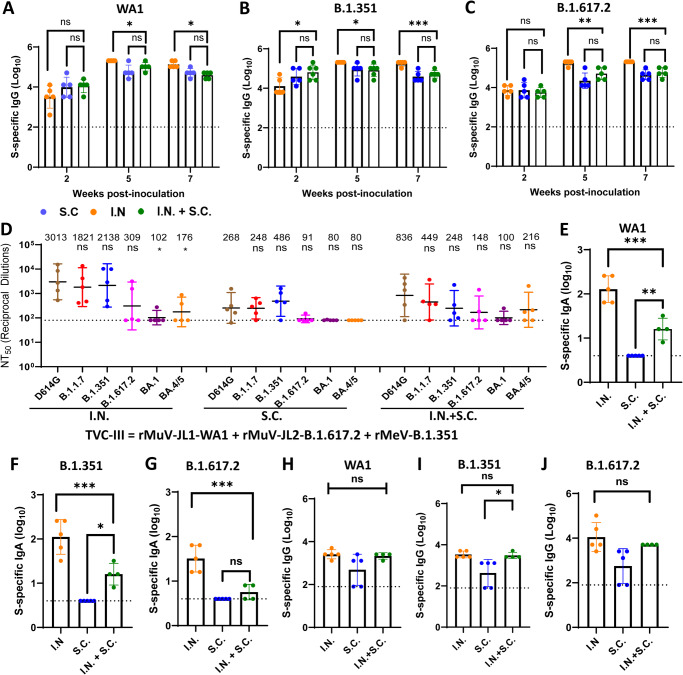
Fig. 2. Intranasal immunization of trivalent vaccine (TVC-III) is superior to subcutaneous or a combination of intranasal and subcutaneous route.
IFNAR1−/− mice were immunized with 1.2×10⁶ PFU of TVC-III (rMuV-JL1-WA1 + rMuV-JL2-B.1.617.2 + rMeV-B.1.351) via I.N., S.C., or I.N. + S.C., and were boosted via the same route three weeks later. At weeks 2, 5, and 7, serum was collected for detection of S-specific IgG titer by ELISA using preS-6P protein of SARS-CoV-2 WA1 (A), B.1.351 (B), or B.1.617.2 (C) as the coating antigen. The P-value for I.N. vs I.N. + S.C. in (A–C) is: A, *P = 0.013349 (week 5) and *P = 0.013349 (week 7); B, *P = 0.013349 (week 2), *P = 0.039969 (week 5), and ***P = 0.000478 (week 7); C, **P = 0.006271 (week 5) and ***P = 0.000478 (week 7). Sera at week 7 were used for detection of SARS-CoV-2 NAbs using a lentivirus pseudotyped neutralization assay against SARS-CoV-2 WA1 (D614G), B.1.1.7, B.1.351, B.1.617.2, Omicron BA.1 (B.1.1.529), or BA.4/5 spike. The 50% neutralization titer (NT50) was calculated for each serum sample (D). Data are the mean of five mice (n = 5) ± SD. The P-value for BA.1 and BA.4/5 vs WA1 (D614G) is *P = 0.0426 and *P = 0.0279, respectively. At week 7, mice were euthanized, and BAL was collected from the lungs of each mouse for detection of IgA titer by ELISA using the preS-6P protein of SARS-CoV-2 WA1 (E), B.1.351 (F), or B.1.617.2 (G), and for detection of IgG titer by ELISA using the preS-6P protein of SARS-CoV-2 WA1 (H), B.1.351 (I), or B.1.617.2 (J). All antibody titers are the GMT of 5 or 4 mice (n = 5 or 4) ± SD. The dotted line indicates the limit of detection. In E, the P-value for I.N. and S.C. vs I.N. + S.C. is ***P = 0.0002 and **P = 0.0036, respectively. In F, the P-value for I.N. and S.C. vs I.N. + S.C. is ***P = 0.0013 and *P = 0.0121, respectively. In G, the P-value for I.N. vs I.N. + S.C. is ***P = 0.0003. In I, the P-value for S.C. vs I.N. + S.C. is ***P = 0.0194. Statistical analyses were conducted using one-way ANOVA (*P < 0.05; **P <0.01; ***P < 0.001; ****P < 0.0001; ns not significant). Source data are provided in the Source Data file.

