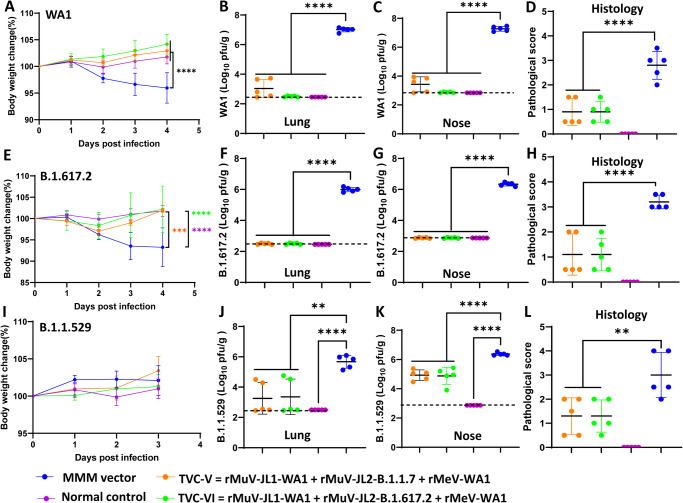
Fig. 7. Trivalent vaccine candidates (TVC-V and TVC-VI) protect hamsters against challenge with SARS-CoV-2 WA1 and variants of concern.
At week 7, 5 hamsters (n = 5) in each group in Fig. 6A were challenged with SARS-CoV-2 WA1 (A–D), B.1.617.2 (E–H), or B.1.1.529 (I–L). Changes in body weight after challenge with SARS-CoV-2 WA1 (A), B.1.617.2 (E) or B.1.1.529 (I). Normal refers to animals inoculated with DMEM. Percent of weight on the challenge day was shown. Data are the average of 5 hamsters (n = 5) ± SD. Viral burden in the lung after challenge with SARS-CoV-2 WA1 (B), B.1.617.2 (F), or B.1.1.529 (J). Viral burden in the nasal turbinate after challenge with SARS-CoV-2 WA1 (C), B.1.617.2 (G), or B.1.1.529 (K). Hamsters challenged with SARS-CoV-2 WA1 or B.1.617.2 were euthanized at day 4 whereas hamsters challenged with B.1.1.529 were euthanized at day 3. Lung histopathological score after challenge with SARS-CoV-2 WA1 (D), B.1.617.2 (H), or B.1.1.529 (L). Viral titers are the GMT of 5 hamsters ± SD. The dotted line indicates the detection limit. Pathology of each lung section was scored based on the severity of histologic changes. Score of 0, 1, 2, 3, and 4 represents no, mild, moderate, severe, and extremely severe pathological changes. Data are the mean of 5 hamsters ± SD. The P-value for TVC-V, TVC-VI, and normal vs MMM vector is: A, ****P < 1 × 10⁻¹⁵, ****P < 1 × 10⁻¹⁵, and ****P = 2.974 × 10⁻⁸; B, ****P = 6.38 × 10⁻¹², ****P = 1.08 × 10⁻¹², and ****P = 9.53 × 10⁻¹³; C, ****P = 1.34 × 10⁻¹², ****P = 1.6 × 10⁻¹³, and ****P = 1.5 × 10⁻¹³; D, ****P < 1 × 10⁻¹⁵, ****P < 1 × 10⁻¹⁵, and ****P < 1 × 10⁻¹⁵; E, ***P = 4.19 × 10⁻⁴, ****P = 9.59 × 10⁻⁶, and ****P = 3.37 × 10⁻⁷; F, ***P = 2.3 × 10⁻¹⁴, ****P = 2.3 × 10⁻¹⁴, and ****P = 2.3 × 10⁻¹⁴; G, *** P = 2.3 × 10⁻¹⁴, **** P = 2.3 × 10⁻¹⁴, and **** P = 2.3 × 10⁻¹⁴; H, ****P < 1 × 10⁻¹⁵, **** P < 1 × 10⁻¹⁵, and **** P < 1 × 10⁻¹⁵; I, P = 0.8766, *P = 0.028, and ****P = 0.0086; J, **P = 0.0012, **P = 0.0018, and ****P = 7.208 × 10⁻⁵; K, ****P = 3.505 × 10⁻⁵, ****P = 2.170 × 10⁻⁵, and ****P = 1.575 × 10⁻¹⁰; L, **P = 0.0035, **P = 0.0035, and **** P < 1 × 10⁻¹⁵. Data were analyzed using two-way ANOVA and one-way ANOVA (*P < 0.05; **P < 0.01; ***P < 0.001; ****P < 0.0001).

