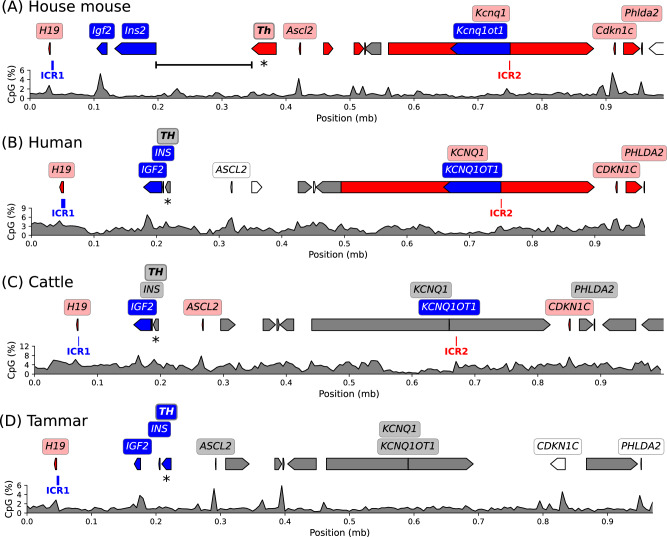
Fig. 2. Parent-of-origin-specific expression in the broader ICR1/ICR2 imprinted region.
The genomic context of the orthologous TH/INS locus is shown for the (A) house mouse, (B) human, (C) cattle and (D) tammar wallaby. The colour of the gene indicates parental expression; blue is paternal, red is maternal, grey is unknown, white is biallelic. The paternally-methylated ICR1 position is indicated in blue, the maternally-methylated ICR2 position is noted in red. The TH gene is marked with an asterisk. The genomic distance between Th and Ins2 is indicated for the mouse (A). The KCNQ1OT1 position in cattle and tammar indicates 500 and 400 bp amplicons that have been detected for this transcript (Ager et al. 2007; Robbins et al. 2012). Plots below display CpG density as a percentage averaged over 5 kilobase (kb) windows, mb: million base pairs.

