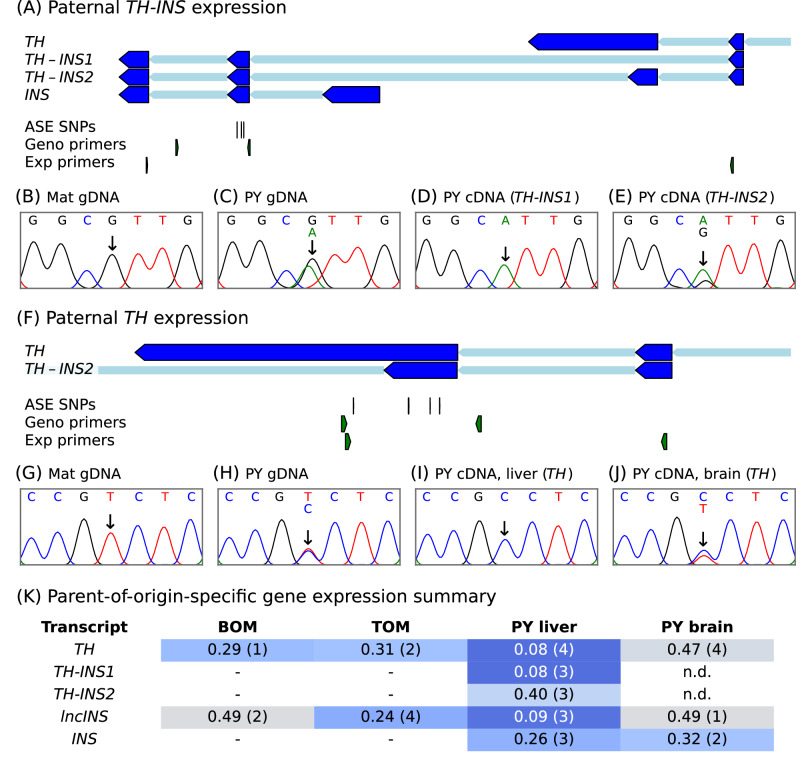
Fig. 4. Paternal transcription of TH/INS in the tammar wallaby.
A, F Primer and SNP positions for allele-specific expression (ASE) analysis of TH-INS and TH. The blue colour of the exons reflects the paternal expression pattern. The TH-INS genotyping primer set (Geno primers) had at least one intronic primer; the cDNA expression primer set (Exp primers) had an intron-spanning primer. B–E, G–J Parent-of-origin-specific transcription of TH-INS and TH. Sanger sequencing chromatograms showing the presence of (B, G) the homozygous maternal genotype, (C, H) the heterozygous SNP in PY gDNA, and (D, E, I, J) the allele present in PY cDNA. K Tabular summary of parent-of-origin-specific gene expression for the different RNA species detected from the TH/INS locus. A mean “mat:pat ratio” value closer to 0 indicates paternal expression (blue shading) while values closer to 0.5 indicate biallelic expression (grey shading). The number of animals is in brackets. “n.d.” indicates not detected. Placenta tissues taken from fetal stage samples, liver and brain taken from PY stage samples. BOM bilaminar omphalopleure, TOM trilaminar omphalopleure. See also, Supplementary Fig. 1 and Supplementary Table 3.

