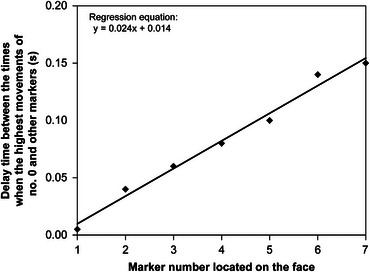
FIGURE 5.

Example of the relationship between the delay times between the highest movement at No. 0 marker and those at No. 1 to 7 markers, and the location of No. 1 to 7 markers. This graph shows an example of the delay time between the highest movements of the markers. A straight line, representing a regression line, was calculated from the delay times and markers’ locations. The equation in the graph, y = 0.024x + 0.014, denotes the regression equation. Here, “0.024” indicates the regression coefficient (slope), suggesting the degree of delay. This coefficient shows that the delay times linearly increase with the growing distance from marker No. 0.
